Tim Trainum Properties
"Delivering a Preferred Experience in Real Estate!"
REALTOR®, VA License #0225235004



Key Local Market Info!
 RSS Feed
RSS Feed
- 2026 | 9 Posts
- 2025 | 12 Posts
- 2024 | 12 Posts
- 2023 | 12 Posts
- 2022 | 13 Posts
- 2021 | 13 Posts
- 2020 | 12 Posts
- 2019 | 15 Posts
- 2018 | 15 Posts
Subscribe and receive email notifications of new blog posts.
September
9
9
Northern Virginia Home Prices in Seasonal Decline; Big Inventory Differences by Home Type
August Highlights:
- PRICES IN SEASONAL DECLINE; CONDO INVENTORY WAY UP
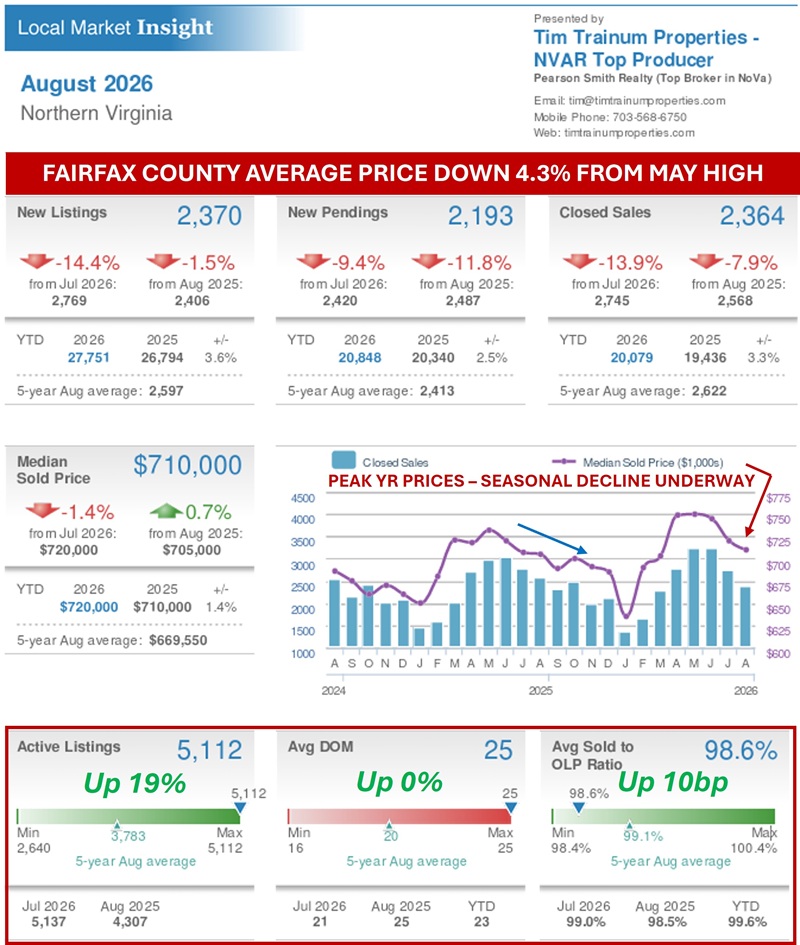
- Fairfax County Average Price DOWN 4.3% From May High
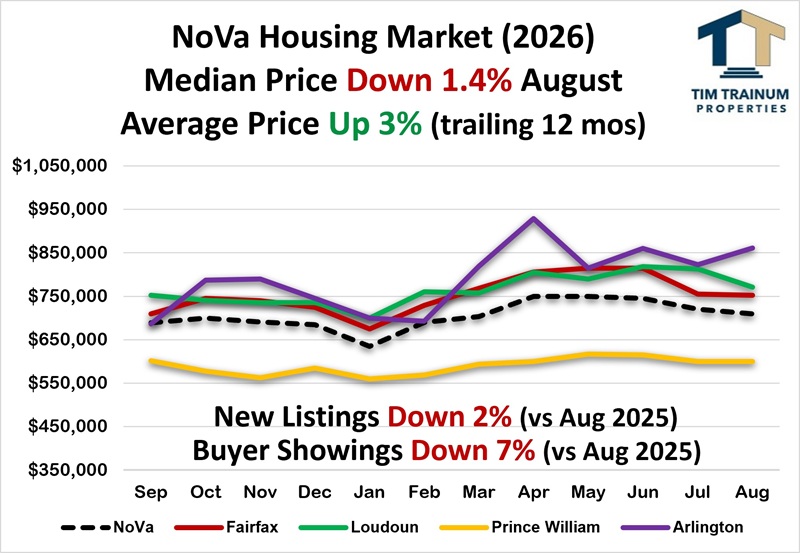
Home prices peaked as usual in May/June (contracts written in April/May) across all Northern Virginia sub-markets. The typical seasonal price decline is now underway in Northern Virginia with a shrinking summer buyer pool. The median price declined 1.4% from July to August. Prices typically stabilize in September with a spike in buyer showings (demand) after Labor Day. The three important top-line market metrics remain consistent through August. Here is August 2026 compared to August 2025 - Active Listings (UP 19%), Days on Market (UP 0%), and Sold-to-List Price Ratio (UP 10bp). - Buyer Showings UP 1% in 2026
Buyer showings (demand) in August were DOWN 7% compared to last year, likely due to rising interest rates. Despite showings being UP 1% for the year (5,800 more showings in the DC metro area), showings have decelerated the last three months, tracking DOWN 4%, 5%, and 7% Jun-Aug. The average age of a first-time homebuyer surged to 40 years old. Up from 33 years old in 2021 and 29 years old in 1981. - Listings DOWN 14% from July to August
This is consistent with last month DOWN 10% and the typical average DOWN 10% during the last 6 years. - August Listings DOWN 9% vs. 5-year Average
Seller listings stabilized in 2024, resisting the continued downtrend experienced in recent years. Listings remain slightly down compared to long-term averages (-9%), but have substantially improved in Northern Virginia from down 20 to 40% in recent years. This improvement is primarily because the higher listing years before the pandemic continue to fall out of the 5-year calculation. This increasing supply helped to increase total homes sold in Jan-Aug 2026 (20,079) compared to Jan-Aug 2025 (19,436) - UP 3%. - "Rate Locked Sellers" are UNLOCKING Increasing Inventory
In the wake of rising interest rates beginning in 2022, sellers largely "stayed in place" in 2023 and 2024. However, in 2025, sellers brought an increasing number of New Listings to the market (UP 8%). Seller behavior continues to trend this year UP 4% through August. The typical home seller is now 63 years old, a record high. This compares to age 54 in 2014 and age 45 in 2007. - Contract Ratio FALLS to 0.47 (stronger shift toward buyers)
Listings Under Contract represent 32% of the total August listings compared to those available and Active for sale at 68%. This slightly declined from the 34/66 seen in July and was a marked shift toward buyers from the 44/56 in May and 39/61 in June. August 2026 paced about 21% slower than the 37/63 seen in August 2025. Seller Price Reductions are holding at near relative highs, now tracking 39% of the current 5,100 Active listings in mid-September. The importance of sellers correctly pricing a home in today's market cannot be overstated. - Inventory UP 15% vs. August 2025
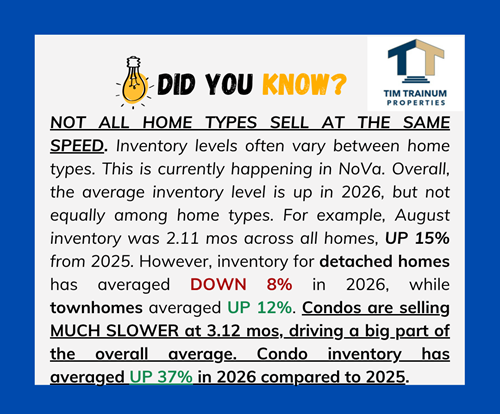
Inventory in Northern Virginia has been relatively steady in 2026 after 2025's fast-paced uptrend over 2024. August inventory of 2.11 months matched July's 2.10 months. August inventory is UP 15% from August 2025. The higher inventory in 2025-26 is primarily a result of a marked increase in the number of Active Listings lasting on the market. There are about 2,600+ more Active Listings at any one time than in 2024 and earlier. This presents a relatively balanced buyer-seller market compared to 2020-24 when August inventory ranged from just 0.99 to 1.37 mos. - Sold-to-List Price Ratio UP 10bp Displays Some Buyer Flex
Buyer contract prices averaged 98.6% of Seller Asking in August - down slightly from 99% in July. However, this is up 10 basis points from the 98.5% experienced in August 2025. A declining Sold-to-List Price Ratio is typical in the slower summer months with falling Contract Ratios. The contract cancellation rate generally ranges between 12 and 18%. The current cancellation rates in mid-September are trending between 20 to 25%, relatively higher than normal for this time of year. - Speed to Contract is SLIGHTLY DOWN from 2025
Speed to contract is consistent with last year and seasonal trends. In August, 42% of the 2,364 homes sold transacted in the fastest range (0 to 10 days), down from 48% in July, and down slightly from 44% in August 2025. By contrast, 32% of sales exceeded 30+ days on market - same as August 2025. The average days on market in August was 25 - same as August 2025.
- Fed July Meeting: RATE STEADY at 3.50%
In line with market expectations, the Fed left its benchmark rate unchanged at the July meeting. There was no August meeting. The next meeting is scheduled for tomorrow, September 16. The recent hawkish sentiment from the Fed's voting membership has moved the futures to an 90% chance of a 0.25% rate increase. This is up significantly from a 33% chance last month. - Headline Inflation STEADY at 3.4%, STEADY at 0.4% Jul to Aug
Inflation in August matched July at 3.4% year-to-year and 0.4% from July. Both numbers were in-line with expectations. "Core Inflation" fell slightly from 2.5% to 2.4% in August. Core inflation excludes more volatile energy and food prices. - Conventional Mortgage Rate RISES to Upper/Mid 6's
With the increase in inflation during the last several months, mortgage rates have been pressured upward. Rates have increased about 1/2 point in the past month to the upper end of the 6 to 7% general trading range seen since 2023. Conforming rates are hovering around near 7% and VA/FHA rates around 6.5%.


Tim Trainum Properties
Office: (571) 386-1075 Cell: (703) 568-6750 Email Me
- 43777 Central Station Drive
- Suite 390
- Ashburn, VA 20147
Office: (571) 386-1075 Cell: (703) 568-6750 Email Me



Privacy Policy / DMCA Notice / ADA Accessibility


This site is hosted, designed and copyright
© 1994 - 2026 by
Delta Media Group, Inc. -- Patent Pending --