Tim Trainum Properties
"Delivering a Preferred Experience in Real Estate!"
REALTOR®, VA License #0225235004

Key Local Market Info!
 RSS Feed
RSS Feed
- 2026 | 7 Posts
- 2025 | 12 Posts
- 2024 | 12 Posts
- 2023 | 12 Posts
- 2022 | 13 Posts
- 2021 | 13 Posts
- 2020 | 12 Posts
- 2019 | 15 Posts
- 2018 | 15 Posts
Subscribe and receive email notifications of new blog posts.
January
11
11
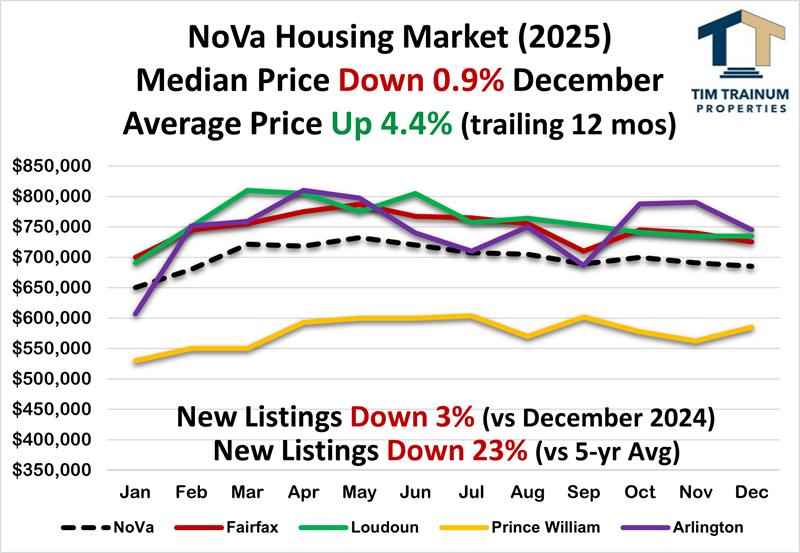
Northern Virginia Experiences Key Market Shifts in 2025; Prices Still Up 4.4%
December Highlights:
- TWO FACTS IN 2025; SHIFTING MARKET & PRICES UP 4.4%
- Northern Virginia Inventory STABILIZES into Winter
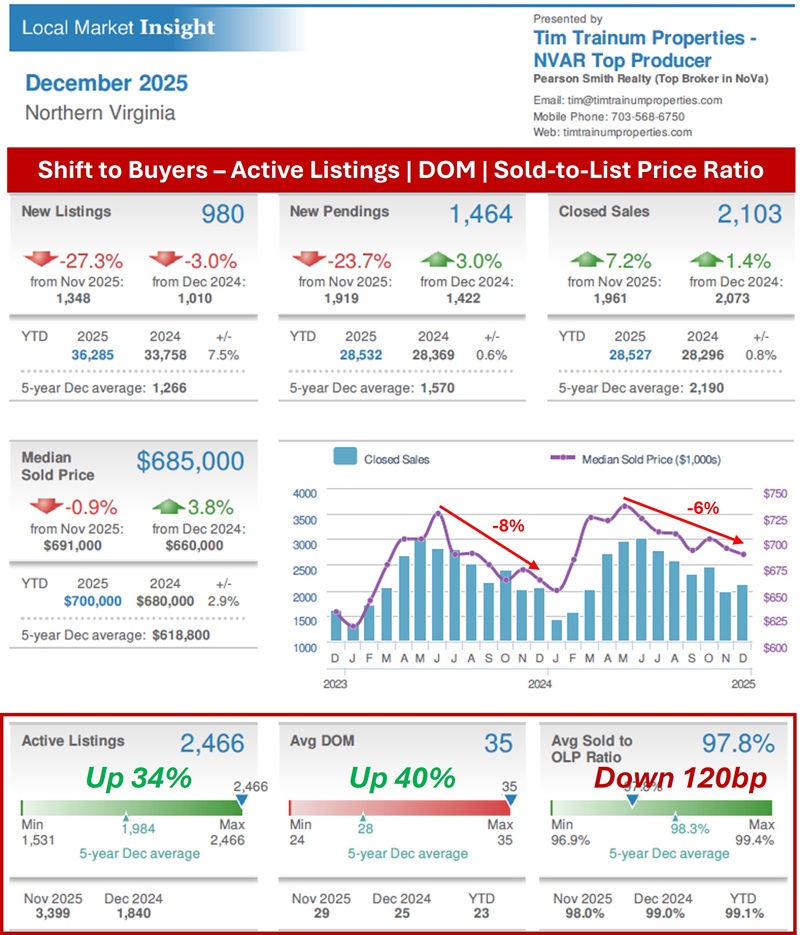
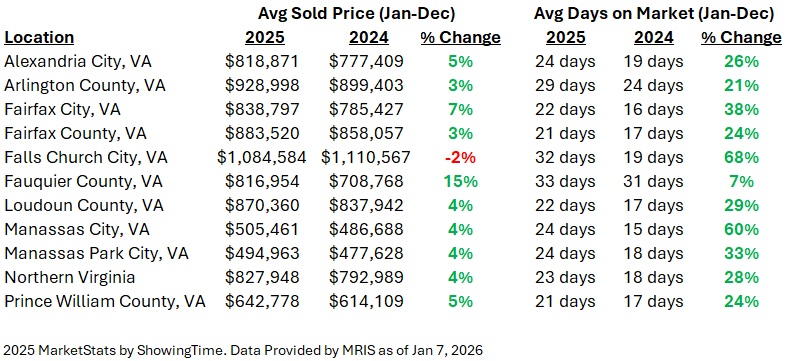
The upward trend in inventory since spring stabilized into fall and early winter. Northern Virginia home inventory traded in a relatively tight range from 1.76 to 1.91 months during April to October. November inventory fell to 1.43 months then followed through falling to 1.04 months in December. This is typical end of year behavior with fewer New Listings from sellers. Generally, this remains a seller-advantaged level of inventory but is up significantly from the previous November (+38%) and December (+33%). The increase in inventory is reflected in three important market metrics all tracking significant buyer-friendly variances from December 2024 - Active Listings (UP 34%), Days on Market (UP 40%), and Sold-to-List Price Ratio (DOWN 120bp). Despite this market shift toward buyers, prices held relatively strong in 2025 finshing the year UP 4.4%. The increase lags long-term and short-term averages. Long-term, Northern Virginia is UP 5.25% per year since 1975, and UP 7.5% per year since 2020. - Buyer Showings DOWN 3% in 2025
Buyer showings (demand) are down slightly for the year, however, since June showings have been tracking equal to or higher than 2024. Showings were not even impacted by the 43-day government shutdown in October/November as they were materially the same to slightly higher than the same time last year. Turning to now in January, showings last week were UP 19% compared to the same week last year. - Listings DOWN 27% from November to December
The December decline was not as sharp as November which was DOWN 43%. December was relatively on pace with the typical average DOWN 31% during the last 6 years. - December Listings DOWN 23% vs. 5-year Average
Seller listings stabilized in 2024 resisting the continued downtrend experienced in recent years. However, listings remain down compared to long-term averages (-23%). Northern Virginia saw 1% more homes sold in 2025 (28,527) than in 2024 (28,296). - "Rate Locked Sellers" are UNLOCKING Increasing Inventory
In the wake of rising interest rates beginning in 2022, sellers largely "stayed in place" in 2023 and 2024. Finally, sellers brought an increasing number of New Listings to the market in 2025 (36,285) compared to 2024 (33,758) - UP 8%. The typical home seller is now 63 years old, a record high. This compares to age 54 in 2014 and age 45 in 2007. - Contract Ratio STEADY at 0.68 (advantage buyers)
Listings Under Contract represent 40% of the total December listings compared to those available and Active for sale at 60% - unchanged from November. However, this is a marked change from December 2024 when the contract ratio was 0.89 (47% Under Contract and 53% Active for Sale). The Contract Ratio continues to be uncharacteristically buyer-advantaged this year, speaking to the higher inventory. This buyer-advantaged Contract Ratio runs directly to the relatively higher frequency of Seller Price Reductions (32% of currently Active listings). The importance of sellers correctly pricing a home in today's market cannot be overstated.
- Inventory INCREASES 33% vs. December 2024
Inventory in Northern Virginia moved higher in 2025. Most of the year inventory traded between 1.76 and 1.91 months, significantly outpacing 2024 by 35 to 60%. Since March 2024, weekly Active Listings have been running markedly higher than the previous year (currently 29% higher - 1,400 listings in the DC Metro area). This presents a relatively more balanced buyer-seller market than experienced in 2020-24 when December inventory ranged from just 0.39 to 0.80 mos. - Sold-to-List Price Ratio DOWN with Rising Inventory
Buyer contract prices averaged 97.8% of Seller Asking in December. This is notably down from the 99.0% experienced in December 2024. The compressing Sold-to-List Price Ratio this year is consistent with the falling Contract Ratios, seller price reductions, rising Inventory, influx of buyer contract contingencies, and the more balanced market seen this spring and now into winter. The contract cancellation rate has generally ranged between 12 and 18%. The current 23% is tracking higher than usual for this time of year. - Speed to Contract is DOWN from 2024
Speed to contract continues its relatively slower pace with 33% of the 2,103 homes sold in December transacting in the fastest range (0 to 10 days). This is down from 38% in November. By contrast, 45% of sales exceeded 30+ days on market, up from 39% last month. This is a significant difference between now and last year. In December 2024, 44% of homes sold in the fastest range (0 to 10 days), while only 33% in December 2025, down 11 points.
- Fed December Meeting: RATE CUT to 3.50%
In line with market expectations, the Fed reduced its benchmark rate 1/4 point to 3.50% on December 10. Mortgage rates remained largely unchanged after the cut as the bond market (which determines mortgage rates) had likely priced in the cut. The next meeting is scheduled for January 28. The futures market is presently pricing a 95% chance of no change this month. - Headline Inflation FALLS to 2.7%, STEADY at 0.3% Nov to Dec
Inflation fell in December to 2.7% year-to-year compared to November (3.0%). Inflation month-to-month was unchanged at 0.3%. Both numbers were in-line with expectations. "Core Inflation" remained unchanged from last month at 2.6%. Core inflation includes more volatile energy and food prices. - Conventional Mortgage Rate EDGES DOWN into High 5's
Mortgage rates continue to trend down. Last week, rates fell slightly, putting Conforming rates at 5.875% and VA/FHA rates at 5.5%. Rates are trading at a three-year low. Last week's decline may be short-lived since it was primarily due to a purchase of $200 billion in mortgage-backed securities.

Tim Trainum Properties
Office: (571) 386-1075 Cell: (703) 568-6750 Email Me
- 43777 Central Station Drive
- Suite 390
- Ashburn, VA 20147
Office: (571) 386-1075 Cell: (703) 568-6750 Email Me

Privacy Policy / DMCA Notice / ADA Accessibility
This site is hosted, designed and copyright
© 1994 - 2026 by
Delta Media Group, Inc. -- Patent Pending --