Tim Trainum Properties
"Delivering a Preferred Experience in Real Estate!"
REALTOR®, VA License #0225235004

Key Local Market Info!
 RSS Feed
RSS Feed
- 2026 | 4 Posts
- 2025 | 12 Posts
- 2024 | 12 Posts
- 2023 | 12 Posts
- 2022 | 13 Posts
- 2021 | 13 Posts
- 2020 | 12 Posts
- 2019 | 15 Posts
- 2018 | 15 Posts
Subscribe and receive email notifications of new blog posts.
March
11
11
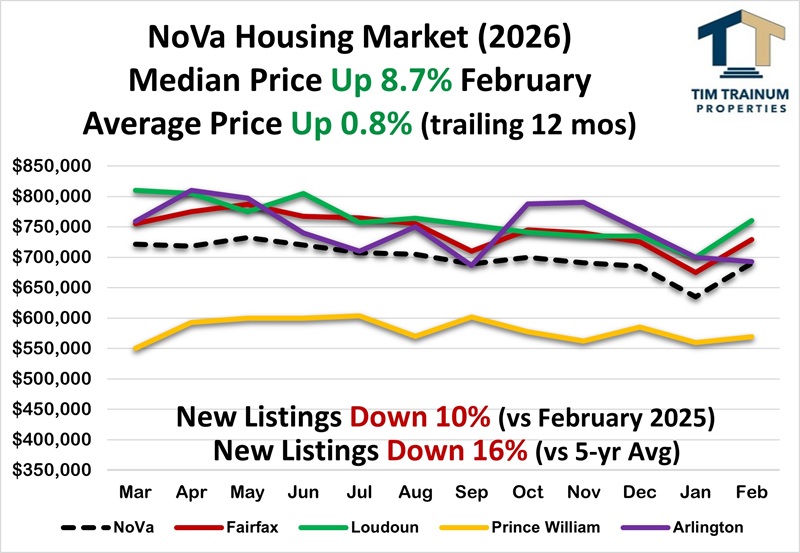
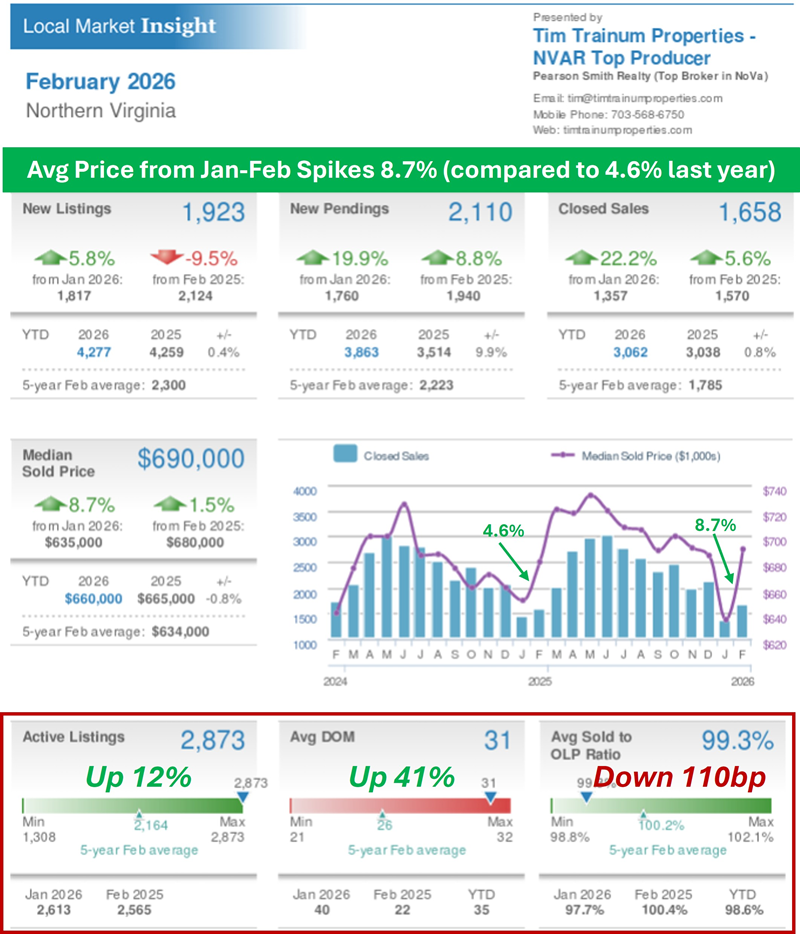
Northern Virginia Home Prices Rebound Strong in February After January's Decline; What's Next?
February Highlights:
- JANUARY TO FEBRUARY PRICE SPIKES UP 8.7%
- February Price Rebounds from January Decline - What's Next?
The median price in February spiked UP 8.7% after January's decline DOWN 1.7%. This is attributed to two things: (1) relatively high showings (buyer demand), and (2) a relatively recent and large 17-point decline in Weekly Active Listings (currently UP 12% compared to 29% this time last year). February's surge pushed the average YTD price to UP 0.8% after January opened DOWN 1.7%. It takes about three months of data to get a sense of the probable trend for the year. Despite February strength, our three important market metrics are all generally tracking significant buyer-friendly variances from February 2025 as was the case for most of last year - Active Listings (UP 12%), Days on Market (UP 41%), and Sold-to-List Price Ratio (DOWN 110bp). - Buyer Showings UP 3% in February 2026
Buyer showings (demand) are up slightly in February 2026 over February 2025 (3%). However, this is despite a significant decline in showings during the recent snow/ice storm. In the weeks before the storm, showings were pacing about 15% above 2025. - Listings UP 6% from January to February
This significantly lags last February's UP 24% as well as the typical average UP 18% during the last 6 years. The decline in listings may have been weather-related, contributing to the 8.7% spike in pricing. - February Listings DOWN 16% vs. 5-year Average
Seller listings stabilized in 2024, resisting the continued downtrend experienced in recent years. Listings remain down compared to long-term averages (-16%), but have substantially improved in Northern Virginia from down 20 to 40% in recent years. This improvement is primarily because the higher listing years before the pandemic continue to fall out of the 5-year calculation. Northern Virginia saw slightly more homes sold in Jan-Feb 2026 (3,062) than in Jan-Feb 2025 (3,038) - UP 1%. - "Rate Locked Sellers" are UNLOCKING Increasing Inventory
In the wake of rising interest rates beginning in 2022, sellers largely "stayed in place" in 2023 and 2024. Sellers brought an increasing number of New Listings to the market in 2025 (UP 8%). This trend continued into 2026 with January listings UP 6% over Jan-2025. It's now only UP 0.4% through February, likely related to the inclement weather. The typical home seller is now 63 years old, a record high. This compares to age 54 in 2014 and age 45 in 2007. - Contract Ratio RISES to 0.84 (shifting toward sellers)
Listings Under Contract represent 46% of the total February listings compared to those available and Active for sale at 54%. This is a further shift toward sellers from the 44/56 seen in January and 40/60 in December, and is relatively consistent with the 45/55 seen in February 2025. The Contract Ratio continues to be uncharacteristically buyer-advantaged like last year, speaking to the higher inventory. This buyer-advantaged Contract Ratio runs directly to the relatively higher frequency of Seller Price Reductions (27% of currently Active listings). The importance of sellers correctly pricing a home in today's market cannot be overstated.
- Inventory INCREASES 11% vs. February 2025
Inventory in Northern Virginia moved higher in 2025 and continues to trend into 2026. February inventory was on the lower range at 1.21 months as seasonally experienced, but is UP 11% over February 2025 (1.09 mos). During most of the seasonal selling period in 2025, inventory traded between 1.76 and 1.91 months, significantly outpacing 2024 by 35 to 60%. Since March 2024, weekly Active Listings have been running markedly higher than the previous year (currently 12% higher - 850 listings in the DC Metro area). This presents a relatively more balanced buyer-seller market than experienced in 2020-24 when February inventory ranged from just 0.34 to 0.96 mos. - Sold-to-List Price Ratio DOWN with Rising Inventory
Buyer contract prices averaged 99.3% of Seller Asking in February. This is notably down from the 100.4% experienced in February 2025. The compressing Sold-to-List Price Ratio this year is consistent with the falling Contract Ratios, seller price reductions, rising inventory, influx of buyer contract contingencies, and the more balanced market seen in 2025 and now into 2026. The contract cancellation rate has generally ranged between 12 and 18%. The current 11% is tracking more seller-advantaged than normal. - Speed to Contract is DOWN from 2025
Speed to contract continues its relatively slower pace with 51% of the 1,658 homes sold in February transacting in the fastest range (0 to 10 days). This is up significantly from 32% in January as seasonally experienced. By contrast, 35% of sales exceeded 30+ days on market, down from 50% last month. This is a significant difference between now and last year. In February 2025, 61% of homes sold in the fastest range (0 to 10 days), while only 51% in February 2026, down 10 points.

- Fed January Meeting: RATE STEADY at 3.50%
In line with market expectations, the Fed left its benchmark rate unchanged at the January meeting. Mortgage rates remained largely unchanged as the bond market (which determines mortgage rates) was not anticipating a cut. The next meeting is scheduled for March 18. The futures market is presently pricing a 99% chance of no change in March. - Headline Inflation STEADY at 2.4%, RISES to 0.3% Jan to Feb
Inflation was unchanged in February at 2.4% year-to-year compared to January (2.4%). Inflation month-to-month slightly increased to 0.3% from January's 0.2%. Both numbers were in line with expectations. "Core Inflation" was unchanged from last month's 2.5%. Core inflation includes more volatile energy and food prices. - Conventional Mortgage Rate STEADY at High 5's
Mortgage rates are steady at relative lows after trending down for several months. Conforming rates are holding just below 6% and VA/FHA rates at 5.625%. Rates are trading at a three-year low.

Tim Trainum Properties
Office: (571) 386-1075 Cell: (703) 568-6750 Email Me
- 43777 Central Station Drive
- Suite 390
- Ashburn, VA 20147
Office: (571) 386-1075 Cell: (703) 568-6750 Email Me

Privacy Policy / DMCA Notice / ADA Accessibility
This site is hosted, designed and copyright
© 1994 - 2026 by
Delta Media Group, Inc. -- Patent Pending --