Tim Trainum Properties
"Delivering a Preferred Experience in Real Estate!"
REALTOR®, VA License #0225235004

Key Local Market Info!
 RSS Feed
RSS Feed
- 2026 | 6 Posts
- 2025 | 12 Posts
- 2024 | 12 Posts
- 2023 | 12 Posts
- 2022 | 13 Posts
- 2021 | 13 Posts
- 2020 | 12 Posts
- 2019 | 15 Posts
- 2018 | 15 Posts
Subscribe and receive email notifications of new blog posts.
May
8
8
Northern Virginia Housing Market Heats Up; All-Time Price Highs Reached in Fairfax & Arlington
April Highlights:
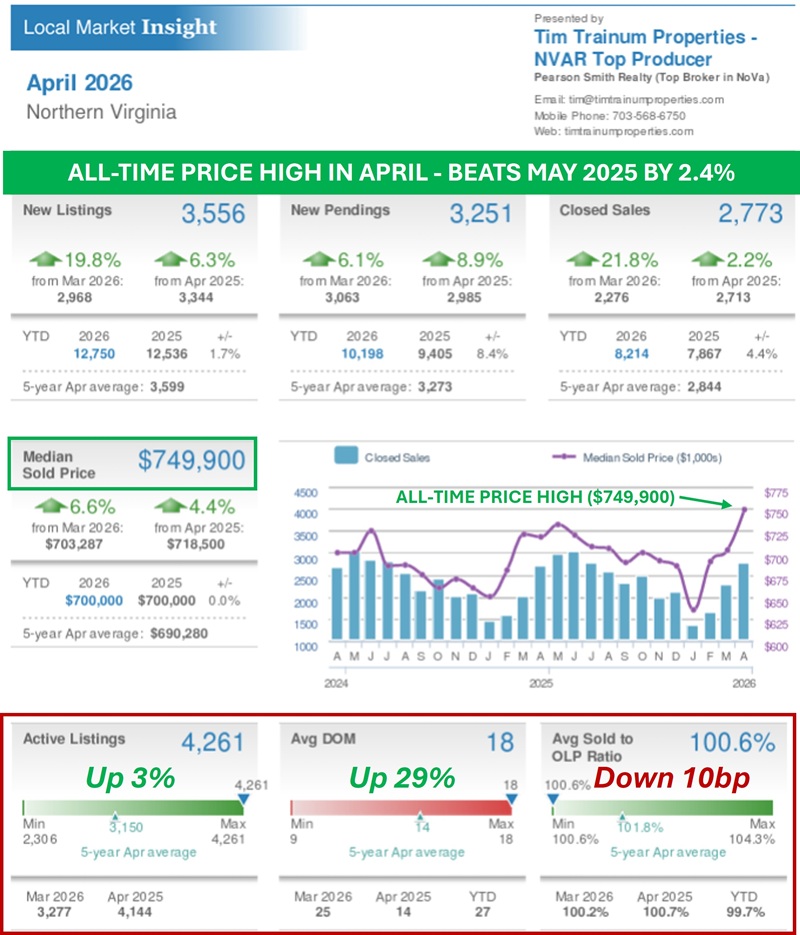
- ALL-TIME HIGH ($749,900) BEATS PREVIOUS MAY 2025 BY 2.4%
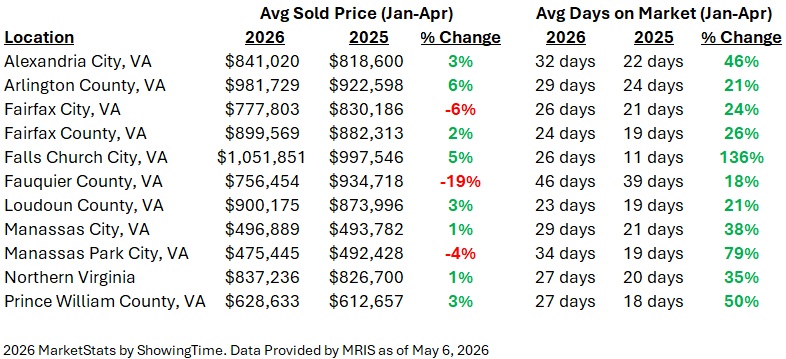
- Northern Virginia, Fairfax & Arlington Counties Hit Highs
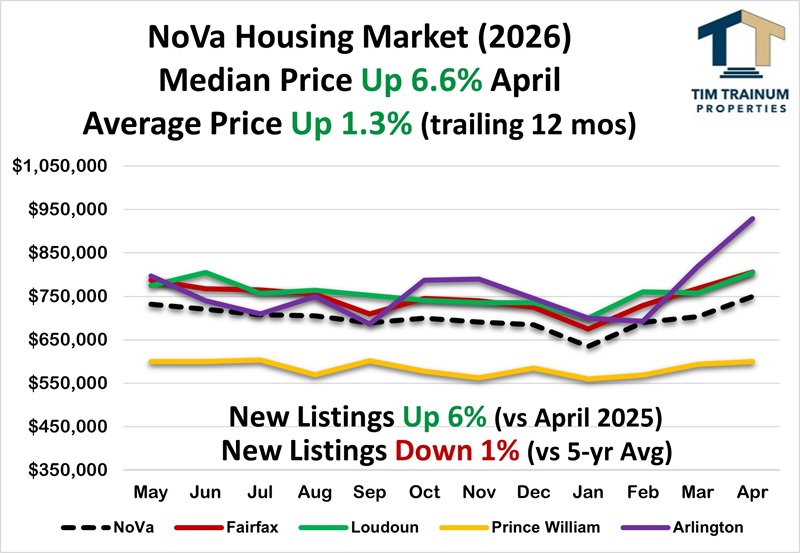
Home prices finished strongly in April. The median price in Northern Virginia hit an all-time high of $749,900, soundly beating the previous high by 2.4% set in May 2025 ($732,500). Likewise, the Fairfax County and Arlington County sub-markets experienced the same price breakouts to all-time highs with Loudoun and Prince William close behind. The rising prices are consistent with other seller advantages like the rapidly declining Active Listings now at just 3% higher than April 2025 compared to last year when it was up 64%. Similarly, the Sold-to-List Price Ratio has compressed to just 10 basis points below April 2025 compared to the negative 140 basis points last year. All this points to an uptick in buyer demand in recent months absorbing excess supply, and shifting the three important top-line market metrics toward sellers. Here is April 2026 compared to April 2025 - Active Listings (UP 3%), Days on Market (UP 29%), and Sold-to-List Price Ratio (DOWN 10bp). By comparison, Active Listings were UP 64% in April 2025 vs April 2024. - Buyer Showings UP 5% in 2026
Buyer showings (demand) in April spiked UP 12% pushing the YTD up from 3 to 5%. There were 12,000 more buyer showings in the D.C. metro area in April 2026 than in April 2025. This is no small number. It means about 2,900 more showings per week in April, indicating possible pent-up buyer demand from the severe winter weather. - Listings UP 20% from March to April
This significantly outpaced last April UP 6% as well as the typical average UP 11% during the last 6 years. April is seasonally a strong month for New Listings and may have been helped along with similar pent-up seller supply from the severe winter weather. - April Listings DOWN 1% vs. 5-year Average
Seller listings stabilized in 2024, resisting the continued downtrend experienced in recent years. Listings remain slightly down compared to long-term averages (-1%), but have substantially improved in Northern Virginia from down 20 to 40% in recent years. In fact, we haven't seen the 5-year average this close to the current period since 2018. This improvement is primarily because the higher listing years before the pandemic continue to fall out of the 5-year calculation. April saw an increase in listings compared to last year (UP 6%). This new supply helped to increase total homes sold in Jan-Apr 2026 (8,214) compared to Jan-Apr 2025 (7,867) - UP 4%. - "Rate Locked Sellers" are UNLOCKING Increasing Inventory
In the wake of rising interest rates beginning in 2022, sellers largely "stayed in place" in 2023 and 2024. Sellers brought an increasing number of New Listings to the market in 2025 (UP 8%). In January, New Listings opened the year UP 6%, but quickly abated with severe winter weather. In April, the YTD number spiked UP 2% reversing from DOWN 2% in March. The typical home seller is now 63 years old, a record high. This compares to age 54 in 2014 and age 45 in 2007. - Contract Ratio RISES to 0.85 (shift toward sellers)
Listings Under Contract represent 46% of the total April listings compared to those available and Active for sale at 54%. This is a slight shift toward buyers from the 49/51 seen in March, but is pacing 12% better than the 43/57 seen in April 2025. More sellers in April (32%), compared to March (26%), reduced prices with Seller Price Reductions at 32% of the currently 3,700 Active listings. The importance of sellers correctly pricing a home in today's market cannot be overstated. - Inventory NO CHANGE vs. April 2025
Inventory in Northern Virginia is steady in 2026 after 2025's fast-paced uptrend over 2024. April inventory of 1.77 months was almost equal to the 1.76 months in April 2025. Inventory has been held down with the rapid decline in Active Listings (currently just 3% higher - 117 listings in the DC Metro area). This presents a relatively balanced buyer-seller market compared to 2020-24 when April inventory ranged from just 0.67 to 1.20 mos. - Sold-to-List Price Ratio STEADY with Higher Inventory
Buyer contract prices averaged 100.6% of Seller Asking in April. This is about the same as the 100.7% experienced in April 2025 and up from 100.2% last month. An improving Sold-to-List Price Ratio is typical in spring months with rising Contract Ratios. The contract cancellation rate has generally ranged between 12 and 18%. The current 11% is tracking more seller-advantaged than normal. - Speed to Contract is SLIGHTLY DOWN from 2025
Speed to contract has improved for sellers in recent months as is typical in Spring, but continues its relatively slower pace in recent years with 66% of the 2,773 homes sold in April transacting in the fastest range (0 to 10 days). This is up from 60% in March. By contrast, 18% of sales exceeded 30+ days on market, down from 24% last month. This is a slight difference between now and last year. In April 2025, 68% of homes sold in the fastest range (0 to 10 days), while 66% in April 2026, down 2 points.

- Fed April Meeting: RATE STEADY at 3.50%
In line with market expectations, the Fed left its benchmark rate unchanged at the April meeting. Mortgage rates remained largely unchanged from Fed action as the bond market (which determines mortgage rates) was not anticipating a cut. The next meeting is scheduled for June 17. The futures market is presently pricing a 98% chance of no change in June. - Headline Inflation RISES to 3.8%, FALLS to 0.6% Mar to Apr
Inflation spiked in April to 3.8% year-to-year compared to March (3.3%). Inflation month-to-month decreased to 0.6% from March's 0.9%. Both numbers were in line with expectations given the recent rapid rise in energy prices. "Core Inflation" increased slightly to 2.8% from last month's 2.6%. Core inflation excludes more volatile energy and food prices. - Conventional Mortgage Rate STEADY in Low 6's
With the recent market volatility, mortgage rates increased with investor flight to safety. Rates increased about 5/8 point to 6.5% before trending down in recent weeks. Conforming rates are hovering around 6.25% and VA/FHA rates at 5.875%. Rates are still trading at a relative three-year low.

Tim Trainum Properties
Office: (571) 386-1075 Cell: (703) 568-6750 Email Me
- 43777 Central Station Drive
- Suite 390
- Ashburn, VA 20147
Office: (571) 386-1075 Cell: (703) 568-6750 Email Me

Privacy Policy / DMCA Notice / ADA Accessibility
This site is hosted, designed and copyright
© 1994 - 2026 by
Delta Media Group, Inc. -- Patent Pending --