
 RSS Feed
- 2026 | 7 Posts
- 2025 | 12 Posts
- 2024 | 12 Posts
- 2023 | 12 Posts
- 2022 | 13 Posts
- 2021 | 13 Posts
- 2020 | 12 Posts
- 2019 | 15 Posts
- 2018 | 15 Posts
Subscribe and receive email notifications of new blog posts.
9
Northern Virginia, We Have a Problem!

Housing Shortage: The Calculation
It's More than Just Supply (Sellers): Buying a home is challenging in today's market. Much of what we see and read laments there is "Low Inventory". Thinking in terms of basic economics many people believe this is because of a lack of supply. Too few sellers are offering to list homes for sale. There simply are not enough homes available. The supply-side is only half of the inventory calculation forgetting about the demand-side.
Absorption Rate (Speed) Determines Inventory: Inventory is the result of a supply-demand calculation involving absorption rate. Absorption rate is the rate at which the market absorbs or eliminates housing inventory. Said another way, it measures how fast or slow homes are trading between buyers and sellers. This calculation produces a housing inventory level typically measured in months. In a "normal" low inventory environment for Northern Virginia (2016-20), we regularly worked with 2 to 3 months of inventory depending on the time of year. From late 2020 to now, we have typically seen only 0.5 to 1.5 months of inventory.
Housing Shortage: The Cause May Not Be What You Thought?
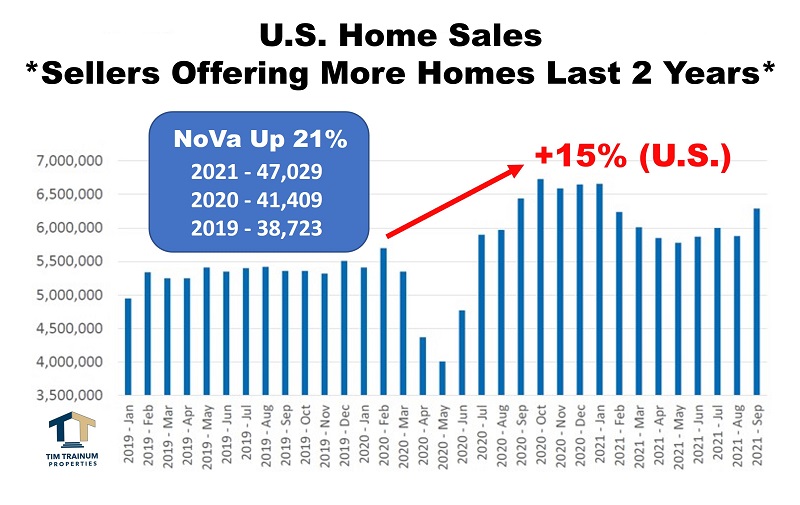
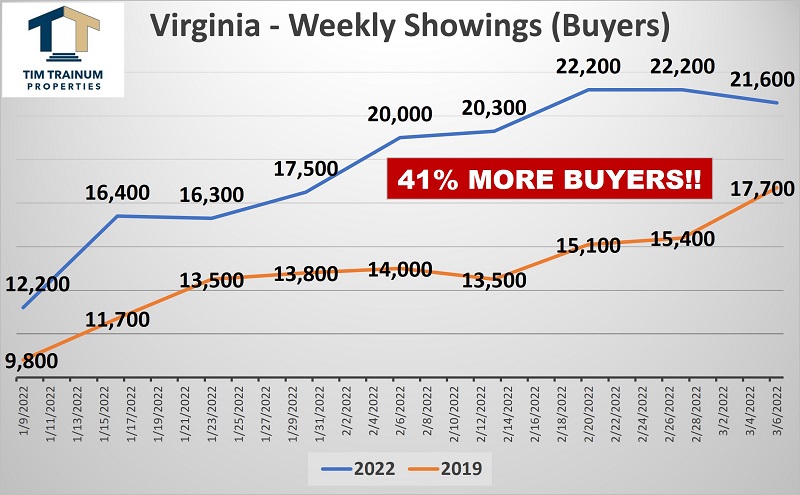
Buyers, Buyers & More Buyers: The two charts below basically tell the story. Most people are surprised to learn in 2021 there were 8,000 (21%) more homes sold in Northern Virginia compared to 2019. Contrary to what you may hear, sellers have been bringing more homes to market in force. Then, why is inventory still so low? The second chart answers that question. Northern Virginia has experienced a buyer surge in the last 18 months. This is best measured by the number of showings (buyer tours) scheduled at homes listed for sale on the MLS. In the recent four weeks alone, there are 41% more buyers now than during the same period in 2019. At times, this has been as high as 50% more buyers prospecting for homes.
(Excessive Number of Buyers) - (Elevated Number of Homes For Sale) = Low Inventory

- 43777 Central Station Drive
- Suite 390
- Ashburn, VA 20147
Office: (571) 386-1075 Cell: (703) 568-6750 Email Me

Privacy Policy / DMCA Notice / ADA Accessibility