Tim Trainum Properties
"Delivering a Preferred Experience in Real Estate!"
REALTOR®, VA License #0225235004

Key Local Market Info!
 RSS Feed
RSS Feed
- 2026 | 7 Posts
- 2025 | 12 Posts
- 2024 | 12 Posts
- 2023 | 12 Posts
- 2022 | 13 Posts
- 2021 | 13 Posts
- 2020 | 12 Posts
- 2019 | 15 Posts
- 2018 | 15 Posts
Subscribe and receive email notifications of new blog posts.
October
9
9
Northern Virginia Balanced Market Continues to Trend; Prices Remain Up
September Highlights:
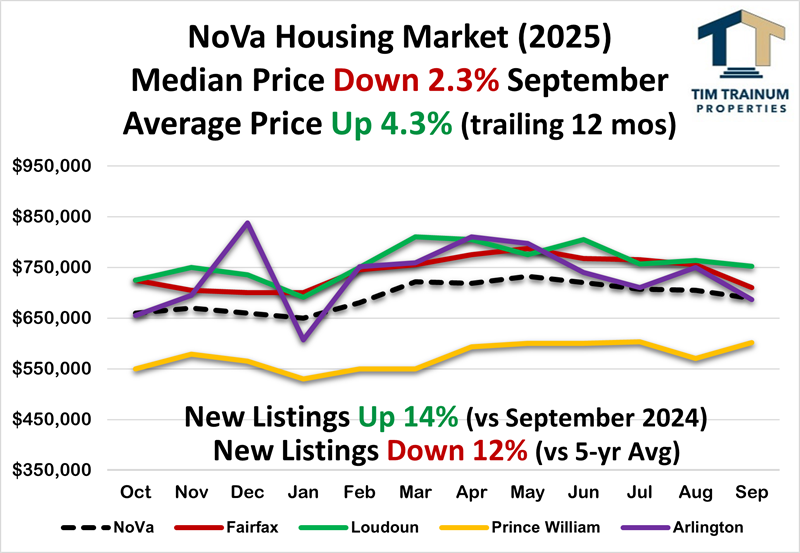
- BALANCED MARKET TRENDING; PRICES STILL UP 4.3% YTD
- Northern Virginia Inventory STABILIZES into Fall
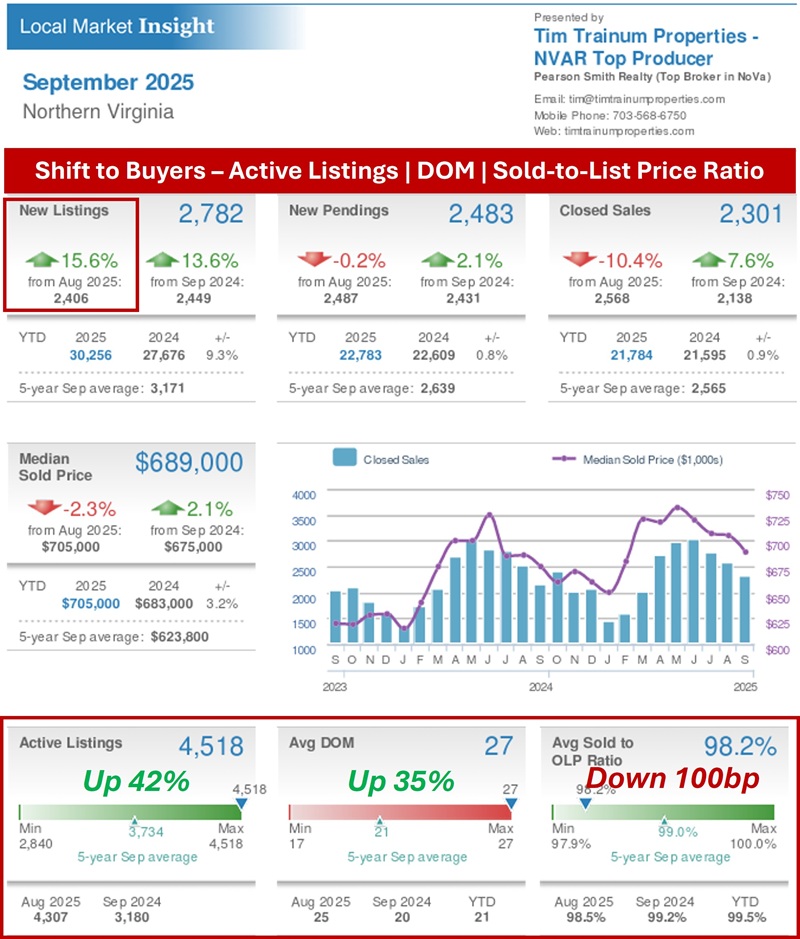
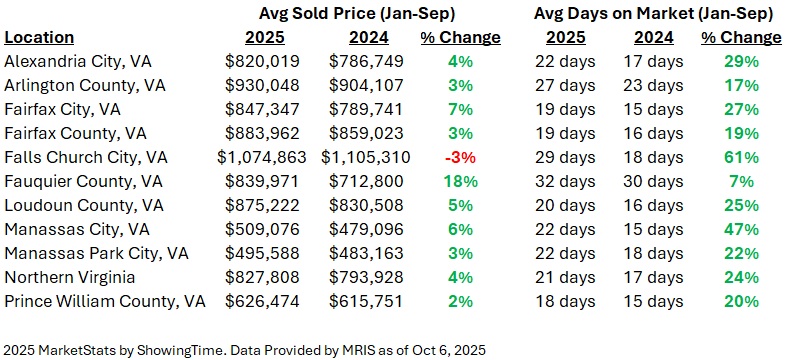
The recent upward trend in inventory over the last several months appears to be stabilizing. Inventory in Northern Virginia has traded in a relatively tight range from 1.76 to 1.91 months since April. Generally, this remains a seller-advantaged level of inventory but is up significantly (36%) from last year. This is reflected in three important market metrics all tracking significant variances from September 2024 - Active Listings (UP 42%), Days on Market (UP 35%), and Sold-to-List Price Ratio (DOWN 100bp). Home prices appear to be plateauing in 2025 year-over-year with clear deceleration month-to-month. Prices began the year UP 11% and have decelerated to UP 4% now. Home prices in the City of Falls Church sub-market are the first to turn negative for the year (-3%). However, it should be noted this is the smallest sub-market in our area with only 130 homes sold YTD. - Buyer Showings DOWN 4% in 2025
Buyer showings (demand) are down slightly for the year, however, for the last several weeks showings have been tracking equal to or higher than 2024. The last two weeks during the government shutdown showings were DOWN 5% and 3%, respectively. - Listings UP 16% from August to September
This is a significant increase from UP 1% in September 2024 as well as the typical average UP 0.3% during the last 6 years. - September Listings DOWN 12% vs. 5-year Average
Seller listings stabilized in 2024 resisting the continued downtrend experienced in recent years. However, listings remain down compared to long-term averages (-12%). Northern Virginia homes sold in Jan-Sep (21,784) are tracking almost exactly 2024 (21,595). - "Rate Locked Sellers" are UNLOCKING Increasing Inventory
In the wake of rising interest rates beginning in 2022, sellers largely "stayed in place" in 2023 and 2024. Finally, New Listings in Jan-Sep (30,256) are UP 9% compared to Jan-Sep 2024 (27,676). The typical home seller is now 63 years old, a record high. This compares to age 54 in 2014 and age 45 in 2007. - Contract Ratio STEADY at 0.55 (stronger shift toward buyers)
Listings Under Contract represent 35% of the total September listings compared to those available and Active for sale at 65% - little change from July and August. However, this is a significant departure from September 2024 when the contract ratio was 0.81 (43% Under Contract and 57% Active for Sale). The Contract Ratio continues to be uncharacteristically buyer-advantaged this year, speaking to the higher inventory. This buyer-advantaged Contract Ratio runs directly to the relatively higher frequency of Seller Price Declines (12% of Active listings). The importance of sellers correctly pricing a home in today's market cannot be overstated.
- Inventory INCREASES 36% vs. September 2024
Inventory is trending higher in Northern Virginia. September inventory was 1.91 mos, 36% higher than September 2024 inventory of 1.40 mos. Since March 2024, Active Listings have been running markedly higher than the previous year (currently 37% higher - 2,900 listings in the DC Metro area). This presents a relatively more balanced buyer-seller market than experienced in 2020-24 when September inventory ranged from just 1.14 to 1.64 mos. - Sold-to-List Price Ratio DOWN with Rising Inventory
Buyer contract prices averaged 98.2% of Seller Asking in September. This is notably down from the 99.2% experienced in September 2024. The compressing Sold-to-List Price Ratio this year is consistent with the falling Contract Ratios, seller price declines, rising Inventory, influx of buyer contract contingencies, and the more balanced market seen this spring and now into early fall. The current contract cancellation rate has ranged between 15 to 25% (today it's 16%). This is markedly higher than the 10% this time last year. - Speed to Contract is TRENDING DOWN from 2024
Speed to contract continues its relatively slower pace with 40% of the 2,138 homes sold in September transacting in the fastest range (0 to 10 days). This is similar to August. By contrast, 34% of sales exceeded 30+ days on market, also similar to August. However, this is a significant difference between now and last year. In September 2024, 53% of homes sold in the fastest range (0 to 10 days), while only 40% in September 2025, down 13 points.

- Fed September Meeting: RATE CUT to 4.00%
In line with market expectations, the Fed reduced its benchmark rate 1/4 point to 4.00% on September 17. The next meeting is scheduled for October 29. The futures market is presently pricing a 98% chance of another 1/4 point rate cut. Like the September cut, the bond market (which determines mortgage rates) has likely priced in the expected cut in late October. - Headline Inflation RISES to 2.9%, RISES 0.4% Aug to Sep
Due to the government shutdown, the current September CPI data release has been delayed to October 24, nine days later than previously planned on October 15. - Conventional Mortgage Rate FALLS to Low 6's
Mortgage rates continue to trend down to the low-6 range. Rates are at the low end of a 6 to 7.25% trading range seen for almost three years. Rates have seen the low 6's in January 2023, October 2024, and now. VA/FHA rates broke the 5 barrier (now below 5.75%). Rates have been and will continue to be volatile with very high difficulty trying to time the market. Conforming and Jumbo rates are running together in the 6.125% range (jumbo loan is > $1,209,750).

Tim Trainum Properties
Office: (571) 386-1075 Cell: (703) 568-6750 Email Me
- 43777 Central Station Drive
- Suite 390
- Ashburn, VA 20147
Office: (571) 386-1075 Cell: (703) 568-6750 Email Me

Privacy Policy / DMCA Notice / ADA Accessibility
This site is hosted, designed and copyright
© 1994 - 2026 by
Delta Media Group, Inc. -- Patent Pending --