Tim Trainum Properties
"Delivering a Preferred Experience in Real Estate!"
REALTOR®, VA License #0225235004

Key Local Market Info!
 RSS Feed
RSS Feed
- 2026 | 7 Posts
- 2025 | 12 Posts
- 2024 | 12 Posts
- 2023 | 12 Posts
- 2022 | 13 Posts
- 2021 | 13 Posts
- 2020 | 12 Posts
- 2019 | 15 Posts
- 2018 | 15 Posts
Subscribe and receive email notifications of new blog posts.
September
12
12
Northern Virginia Trends Stronger to a More Balanced Housing Market
August Highlights:
- KEY METRICS CONFIRM A MORE BALANCED MARKET
- Northern Virginia Inventory STABILIZES into Late Summer
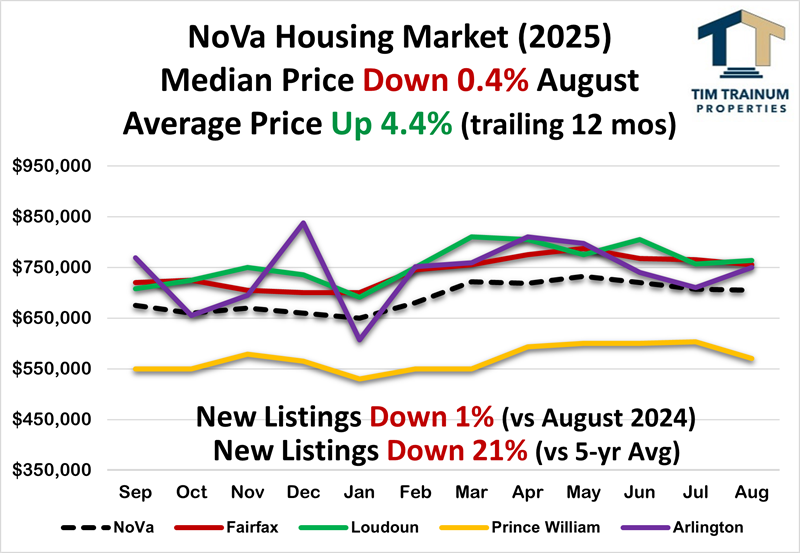
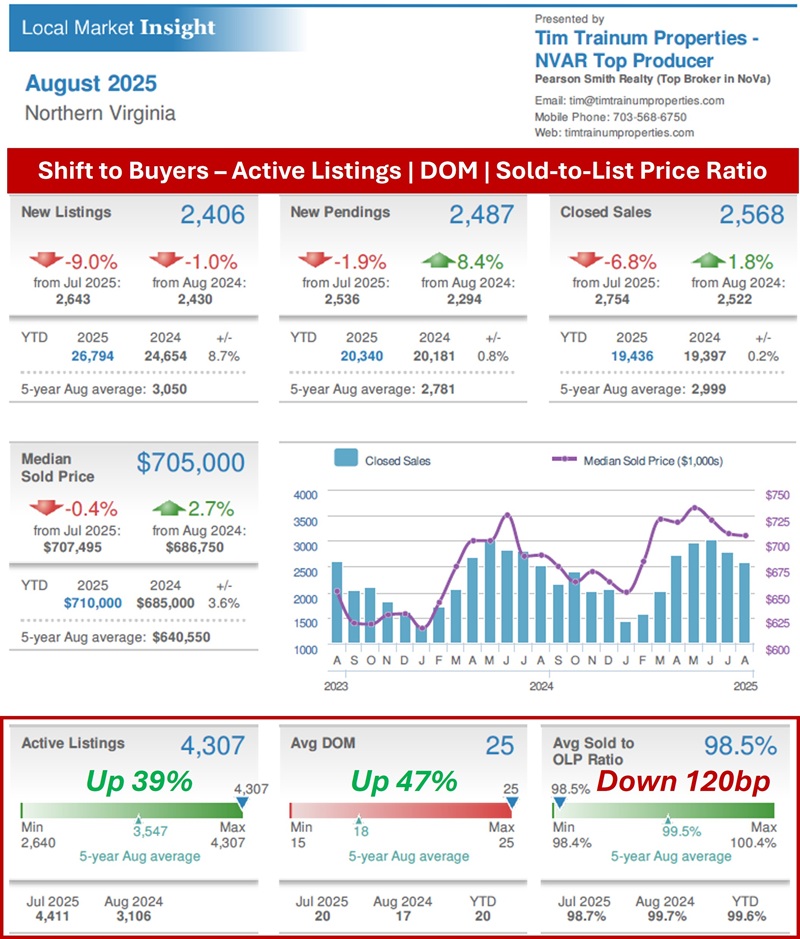
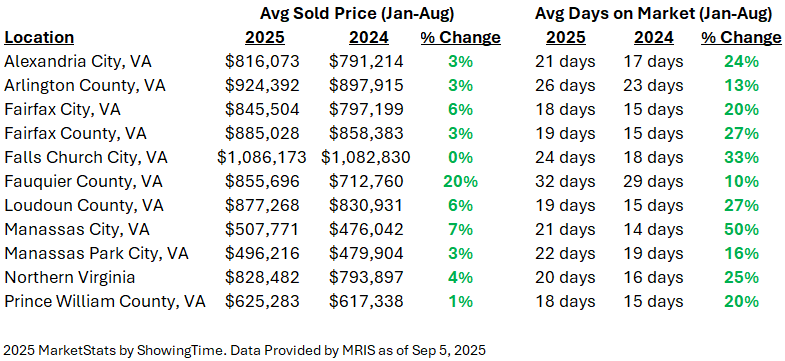
The recent upward trend in inventory over the last several months appears to be stabilizing. In our largest sub-market, Fairfax County, inventory has traded in a relatively tight range of 1.68 to 1.73 months. Generally, this remains a seller-advantaged level of inventory but is up significantly (35%) from last year. This is reflected in three important market metrics all tracking significant variances from August 2024 - Active Listings (UP 39%), Days on Market (UP 47%), and Sold-to-List Price Ratio (DOWN 120bp). Home prices appear to be plateauing in 2025 year-over-year with clear deceleration month-to-month. Prince William Co is leading this deceleration, opening the year in January UP 8% but only UP 1% by August (YTD). Prince William Co could be the first major sub-market turning negative YTD before year-end. - Buyer Showings DOWN 4% in 2025
Buyer showings (demand) are down slightly for the year, however, for the last several weeks showings have been tracking equal to or higher than 2024. August 2025 showings were UP 7% compared to August 2024. Currently, showings are seasonally spiking in the first two weeks of September as typical after Labor Day. This spark of buying usually carries into mid-October. September showings are currently tracking better than 2024 primarily due to the recent fall in interest rates. - Listings DOWN 9% from July to August
This is consistent with DOWN 8% in August 2024 as well as the typical average DOWN 8% during the last 6 years. - August Listings DOWN 21% vs. 5-year Average
Seller listings stabilized in 2024 resisting the continued downtrend experienced in recent years. However, listings remain down compared to long-term averages (-21%). Northern Virginia homes sold in Jan-Aug (19,436) are tracking almost exactly 2024 (19,397). - "Rate Locked Sellers" are UNLOCKING Increasing Inventory
In the wake of rising interest rates beginning in 2022, sellers largely "stayed in place" in 2023 and repeated the same in 2024. Finally, New Listings in Jan-Aug (26,794) are UP 9% compared to Jan-Aug 2024 (24,654). The typical home seller is now 63 years old, a record high. This compares to age 54 in 2014 and age 45 in 2007. - Contract Ratio STEADY at 0.58 (stronger shift toward buyers)
Listings Under Contract represent 37% of the total August listings compared to those available and Active for sale at 63% - no change from July. However, this is a significant departure from August 2024 when the contract ratio was 0.74 (43% Under Contract and 57% Active for Sale). The Contract Ratio continues to be uncharacteristically buyer-advantaged for August speaking to the higher inventory. This buyer-advantaged Contract Ratio runs directly to the relatively higher frequency of Seller Price Declines (11% of Active listings). The importance of sellers correctly pricing a home in today's market cannot be overstated.
- Inventory INCREASES 38% vs. August 2024
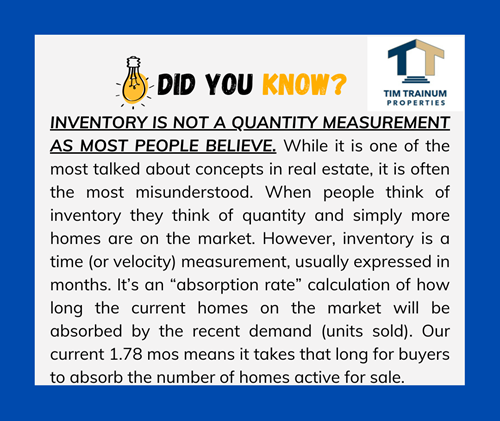
Inventory is trending higher in Northern Virginia. August inventory was 1.78 mos, 38% higher than August 2024 inventory of 1.29 mos. Since March 2024, Active Listings have been running markedly higher than the previous year (currently 36% higher - 2,600 listings in the DC Metro area). This presents a relatively more balanced buyer-seller market than experienced in 2020-24 when August inventory ranged from just 0.93 to 1.29 mos. - Sold-to-List Price Ratio DOWN with Rising Inventory
Buyer contract prices averaged 98.5% of Seller Asking in August. This is notably down from the 99.7% experienced in August 2024. The compressing Sold-to-List Price Ratio is consistent with the falling Contract Ratios, seller price declines, rising Inventory, influx of buyer contract contingencies, and the more balanced market seen this spring and now into late summer. The current contract cancellation rate has ranged between 15 to 25% (today it's 16%). This is markedly higher than the 10% this time last year. - Speed to Contract is TRENDING DOWN from 2024
Speed to contract continues to slow with 44% of the 2,568 homes sold in August transacting in the fastest range (0 to 10 days). This is down 3 pts from 47% in July. By contrast, 32% of sales exceeded 30+ days on market, up from 27% in July. This is a significant difference between now and last year. In August 2024, 56% of homes sold in the fastest range (0 to 10 days), while only 44% in August 2025, down 12 points.
- Fed July Meeting: RATE STEADY at 4.25%
The Fed met on July 30 and decided on no rate cut. There was no meeting scheduled in August. The next meeting is scheduled later this week on September 17. The futures market is presently pricing a 100% chance of a rate cut (96% chance of a 1/4 point, 4% chance of a 1/2 point). Short of a 1/2 point cut, mortgage rates should not be impacted as the bond market controls interest rates. Any Fed move is likely already priced into the market. - Headline Inflation RISES to 2.9%, RISES 0.4% July to August
As reported last week, inflation increased in August to 2.9% year-to-year slightly rising over July (2.7%). Inflation month-to-month increased from 0.2 to 0.4%. Both numbers were in-line with expectations. "Core Inflation" remained the same 3.1% as July. Core inflation includes more volatile energy and food prices. - Conventional Mortgage Rate FALLS to Low 6's
Mortgage rates continue to trend down to the low-6 range. Rates are at the low end of a 6 to 7.25% trading range seen for almost three years. Rates have seen the low 6's in January 2023, October 2024, and now. VA/FHA rates broke the 5 barrier (now below 5.75%). Rates have been and will continue to be volatile with very high difficulty trying to time the market. Conforming and Jumbo rates are running together in the 6.125% range (jumbo loan is > $1,209,750).

Tim Trainum Properties
Office: (571) 386-1075 Cell: (703) 568-6750 Email Me
- 43777 Central Station Drive
- Suite 390
- Ashburn, VA 20147
Office: (571) 386-1075 Cell: (703) 568-6750 Email Me

Privacy Policy / DMCA Notice / ADA Accessibility
This site is hosted, designed and copyright
© 1994 - 2026 by
Delta Media Group, Inc. -- Patent Pending --