Tim Trainum Properties
"Delivering a Preferred Experience in Real Estate!"
REALTOR®, VA License #0225235004

Key Local Market Info!
 RSS Feed
RSS Feed
- 2026 | 7 Posts
- 2025 | 12 Posts
- 2024 | 12 Posts
- 2023 | 12 Posts
- 2022 | 13 Posts
- 2021 | 13 Posts
- 2020 | 12 Posts
- 2019 | 15 Posts
- 2018 | 15 Posts
Subscribe and receive email notifications of new blog posts.
July
11
11
Northern Virginia Key Market Metrics Shifting Toward Buyers; Becoming Less Seller-Advantaged
June Highlights:
- KEY MARKET METRICS SHIFT TOWARD BUYERS; BECOMING LESS SELLER-AVANTAGED
- Northern Virginia Inventory TRENDS HIGHER into Summer
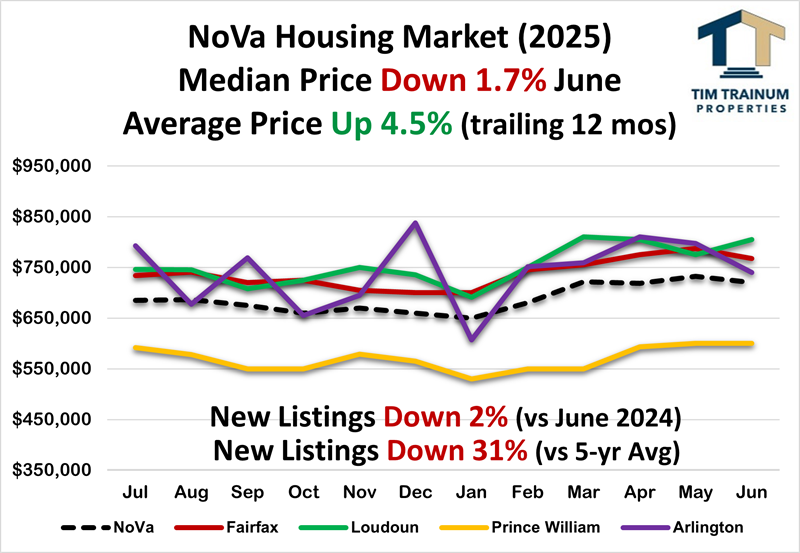
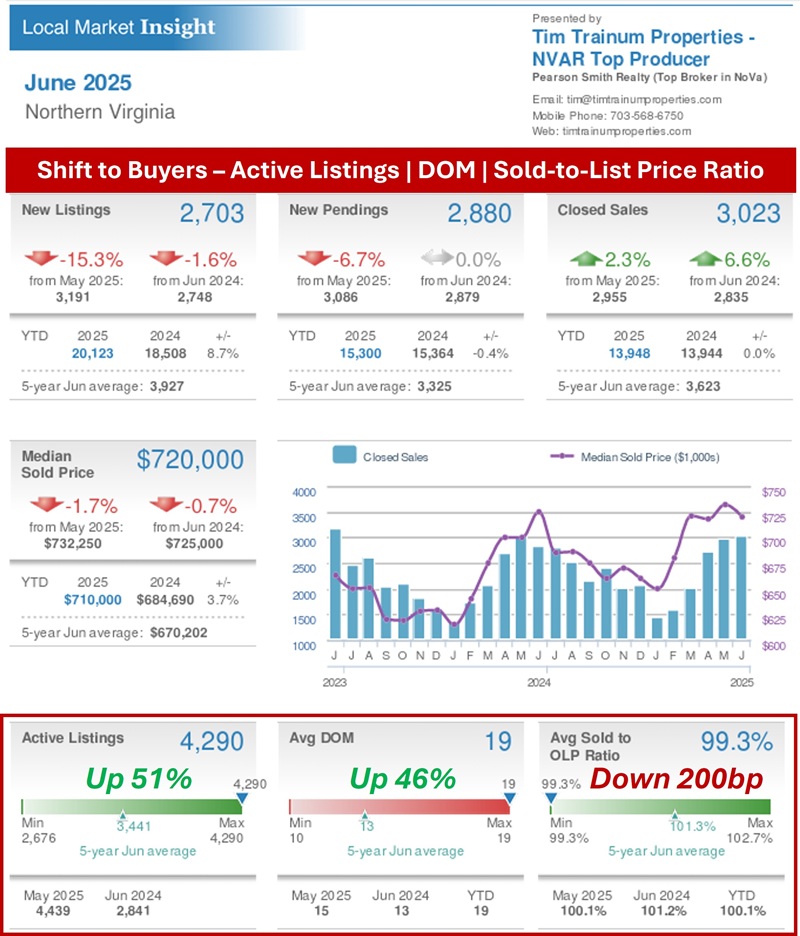
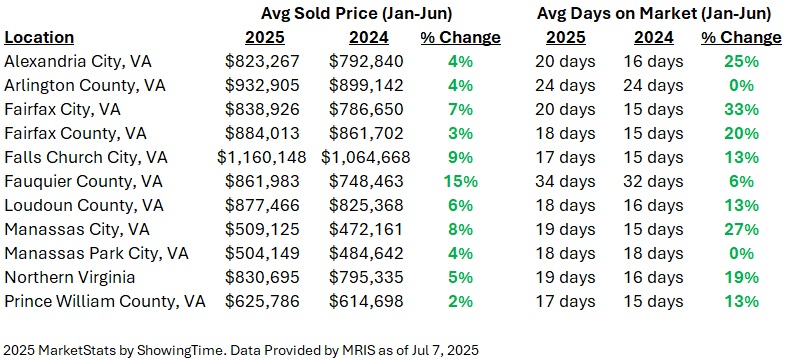
Rising inventory continues to shift the market to a more balanced position between buyers and sellers, something not seen in the last six years. This is reflected in three important market metrics all tracking significant variances from the 5-year average - Active Listings (UP 51%), Days on Market (UP 46%), and Sold-to-List Price Ratio (DOWN 200bp). Despite rising inventory, home prices are holding at relative highs. The median price in our largest sub-market Fairfax County is within 2.5% of its all-time high reached in May ($787,000). Loudoun County is within 1% of its all-time high reached in March ($810,000). Prince William County is within 5% of its all-time high reached in June 2024 ($635,000). However, home prices in Northern Virginia may be showing signs of plateauing as price internals are decelerating. The price increase for YTD 2025 compared to 2024 has been more than halved in the first six months of the year. Prices opened in January UP 11.2% but have declined each subsequent month since to now UP 4.5% by June. This market behavior, and more, is further explained below. - Buyer Showings DOWN 7% in 2025
Buyer showings (demand) are down slightly for the year, however, for the last several weeks showings have been equal to or higher than 2024. The market recently passed its usual Memorial Day holiday inflection point where buyer showings generally top and begin the downtrend to year-end. - Listings DOWN 15% from May to June
This is consistent with DOWN 13% in June 2024 and a departure from the typical average DOWN 8% during the last 6 years. - June Listings DOWN 31% vs. 5-year Average
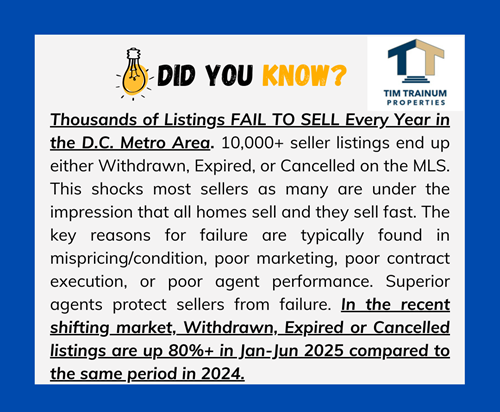
Seller listings stabilized in 2024 resisting the continued downtrend experienced in recent years. However, listings remain down compared to long-term averages (-31%). Northern Virginia homes sold in Jan-Jun (13,948) are tracking almost exactly 2024 (13,944). - "Rate Locked Sellers" are UNLOCKING Increasing Inventory
In the wake of rising interest rates beginning in 2022, sellers largely "stayed in place" in 2023 and repeated the same in 2024. Finally, New Listings in Jan-Jun (20,123) are UP 9% compared to Jan-Jun 2024 (18,508). The typical home seller is now 63 years old, a record high. This compares to age 54 in 2014 and age 45 in 2007. - Contract Ratio FALLS to 0.67 (shift toward buyers)
Listings Under Contract represent 40% of the total June listings compared to those available and Active for sale at 60%. This is a significant departure from June 2024 when the contract ratio was 1.00 (50% Under Contract and 50% Active for Sale). The Contract Ratio is uncharacteristically buyer-advantaged for June and speaks to the higher inventory. This buyer-advantaged Contract Ratio runs directly to the relatively higher frequency of Seller Price Declines (12% of Active listings). The importance of correctly pricing a home in today's market cannot be overstated.
- Inventory INCREASES 78% vs. June 2024
Inventory is trending higher in Northern Virginia. June inventory was 1.8 mos, 78% higher than June 2024 inventory of 1.01 mos. Since March 2024, Active Listings have been running markedly higher than the previous year (currently 40% higher - 3,000+ listings in the DC Metro area). This presents a relatively more balanced buyer-seller market than experienced in 2020-24 when June inventory ranged from a slim 0.83 to 1.03 mos. - Sold-to-List Price Ratio DOWN with Rising Inventory
Buyer contract prices averaged 99.3% of Seller Asking in June. This is down significantly from the 101.2% experienced in June 2024. The compressing Sold-to-List Price ratio is consistent with the falling Contract Ratios, seller price declines, rising Inventory, influx of buyer contract contingencies, and the more balanced market seen this spring and now into summer. The current contract cancellation rate has ranged between 15 to 25% (today it's 22.5%). This is markedly higher than the 10% this time last year. - Speed to Contract is TRENDING DOWN from 2024
Speed to contract is slowing with 53% of the 3,023 homes sold in June transacting in the fastest range (0 to 10 days). This is down 10 pts from 63% in May. By contrast, 20% of sales exceeded 30+ days on market, up from 15% in May. This is a significant difference between now and last year. In June 2024, 69% of homes sold in the fastest range (0 to 10 days), while only 53% in June 2025, down 16 points.
- Fed June Meeting: RATE STEADY at 4.25%
The Fed met on June 18 and decided on no rate cut. The next meeting is scheduled July 30. The futures market is presently pricing a 95% chance of no rate cut at the July meeting. - Headline Inflation RISES to 2.7%, RISES 0.3% May to June
As reported today, inflation increased from May 2.4% to June 2.7% year-to-year. Inflation month-to-month increased from 0.1 to 0.3%. Both numbers were in-line with expectations. "Core Inflation" increased slightly from 2.8% in May to 2.9% in June, in range of its lowest levels since March 2021. Core inflation includes more volatile energy and food prices. - Conventional Mortgage Rate STEADY at 6.5 to 6.75%
Mortgage rates continue to trade in the 6.5 to 7% range for much of 2025. Rates have been and will continue to be volatile with very high difficulty trying to time the market. VA/FHA rates are currently running about 1/2 point lower at 6.125%. Conforming and Jumbo rates are running together in the 6.5% range (jumbo loan is > $1,209,750).

Tim Trainum Properties
Office: (571) 386-1075 Cell: (703) 568-6750 Email Me
- 43777 Central Station Drive
- Suite 390
- Ashburn, VA 20147
Office: (571) 386-1075 Cell: (703) 568-6750 Email Me

Privacy Policy / DMCA Notice / ADA Accessibility
This site is hosted, designed and copyright
© 1994 - 2026 by
Delta Media Group, Inc. -- Patent Pending --