Tim Trainum Properties
"Delivering a Preferred Experience in Real Estate!"
REALTOR®, VA License #0225235004

Key Local Market Info!
 RSS Feed
RSS Feed
- 2026 | 7 Posts
- 2025 | 12 Posts
- 2024 | 12 Posts
- 2023 | 12 Posts
- 2022 | 13 Posts
- 2021 | 13 Posts
- 2020 | 12 Posts
- 2019 | 15 Posts
- 2018 | 15 Posts
Subscribe and receive email notifications of new blog posts.
May
11
11
Northern Virginia Home Inventory Continues to Rise; Reaching Levels Not Seen Since 2017
April Highlights:
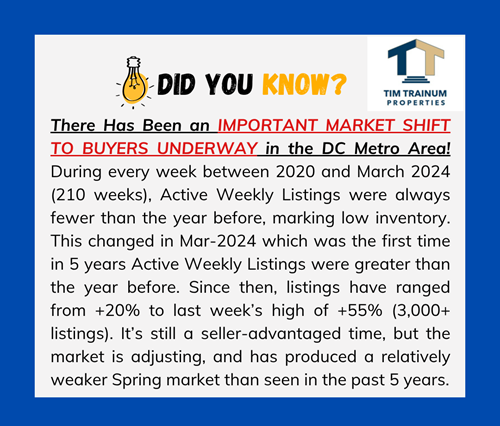
- AN IMPORTANT MARKET SHIFT IS UNDERWAY
- Northern Virginia Inventory is RISING this Spring
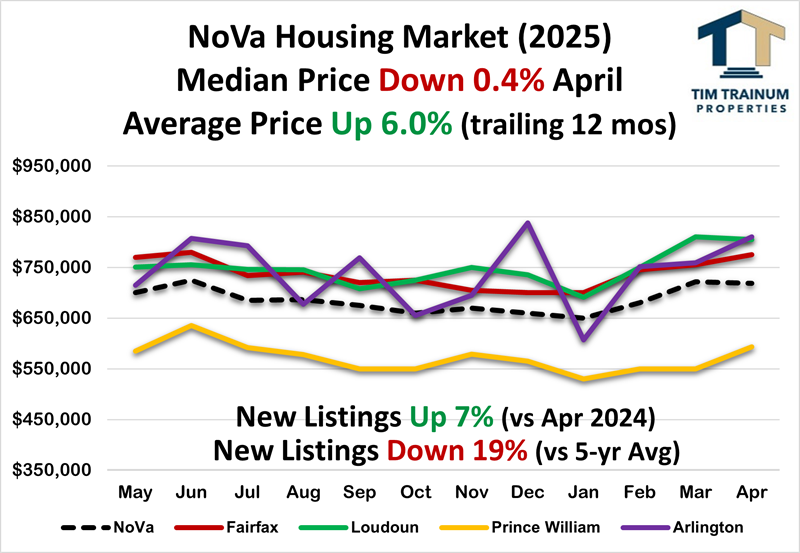
Home prices in Northern Virginia may be showing signs of plateauing. While prices in each major sub-market county are near all-time highs, price internals are showing signs of deflation. The price increase for YTD 2025 compared to 2024 has been halved in the first four months of the year. Prices opened in January UP 11.2% but have deflated to UP 6% by April. The growing Active Weekly Listings trend that began in March 2024 has caused marked changes in inventory is beginning to impact prices. This is further explained a few paragraphs below. - Buyer Showings DOWN 8% in 2025
Buyer showings (demand) continue to hit weekly highs and trend up following seasonal expectations. Overall, Buyer showings are down 8% compared to 2024 almost repeating the 7% decline experienced in 2024 compared to 2023. - Listings UP 6% from March to April
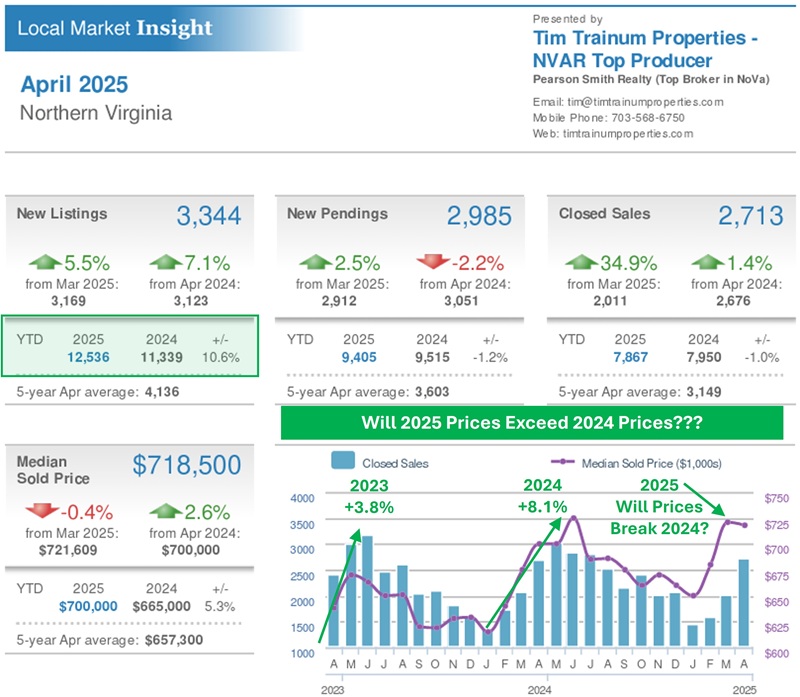
This is on pace with the UP 7% in Apr 2024 but down from the typical average UP 11% during the last 6 years. - April Listings DOWN 19% vs. 5-year Average
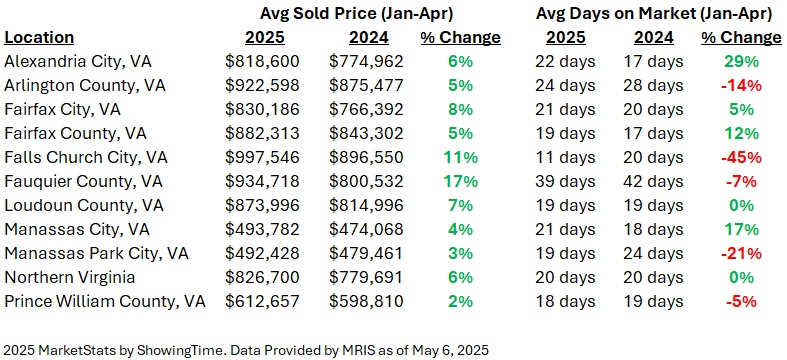
Seller listings stabilized in 2024 resisting the continued downtrend experienced in recent years. However, listings remain down compared to long-term averages (-19%). Notably, with the 5-year average now excluding 2019 from the calculation, the negative number has improved about 20 points from last year's minus mid 30's. Northern Virginia homes sold in Jan-Apr (7,867) are DOWN 1% compared to last year (7,950). - "Rate Locked Sellers" are UNLOCKING Increasing Inventory
In the wake of rising interest rates beginning in 2022, sellers largely "stayed in place" in 2023 and repeated the same in 2024, despite forecasts by economists that inventory would loosen up 15% in 2024. That didn't happen with just 27,623 New Listings in 2024 compared to 27,674 in 2023. Finally, New Listings in Jan-Apr (12,536) are UP 11% compared to Jan-Apr 2024 (11,339). The typical home seller is now 63 years old, a record high. This compares to age 54 in 2014 and age 45 in 2007. - Contract Ratio FALLS to 0.72 (shift toward buyers)
Listings Under Contract represent 42% of the total April listings compared to those available and Active for sale at 58%. This is a significant departure from April 2024 when the contract ratio was 1.21 (58% Under Contract and 42% Active for Sale). The Contract Ratio is uncharacteristically buyer-advantaged for April and speaks to the higher inventory.
- Inventory is Accelerating Higher - RISES to 1.85 mos
Inventory appears to be finally rising in Northern Virginia. Inventory in April was 1.85 mos, 103% higher than April 2024 inventory of 0.91 mos. For several months, Active Listings have been running markedly higher than the previous year (currently 55% higher - 3,000+ listings in the DC Metro area). This presents a relatively more balanced buyer-seller market than experienced in 2020-24 when April inventory ranged from a slim 0.70 to 1.19 mos. April's 1.85 mos. inventory is the highest single month since January 2018 (last 88 months), and the highest April level in 8 years since 2017. - Sold-to-List Price Ratio Relaxes with Rising Inventory
Buyer contract prices averaged 100.7% of Seller Asking in April - same as last month. However, this lags the 102.1% experienced in April 2024. The compressing Sold-to-List Price ratio is consistent with the falling Contract Ratios, rising Inventory, and the more balanced market seen this spring. The current contract cancellation rate is 11% as usual this time of year. - Speed to Contract Spikes into Spring
Speed to contract continues to rise into spring with 68% of the 2,713 homes sold in April transacting in the fastest range (0 to 10 days). This is up 2 points from the 66% seen in March. By contrast, 14% of sales exceeded 30+ days on market (down from 19% last month). Cash transactions represented 16% of the purchases in April.
- Fed May Meeting: RATE STEADY at 4.25%
The Fed met on May 7 and decided on no rate cut. The next meeting is scheduled June 18. The futures market is presently pricing a 92% chance of no rate cut at the June meeting. - Headline Inflation FALLS to 2.3%, RISES 0.2% Mar to Apr
As reported yesterday, inflation dropped from March 2.4% to April 2.3% year-to-year. Inflation month-to-month increased 0.2%. Both numbers ran slightly better than expectations. "Core Inflation" held steady at 2.8%, its lowest level since March 2021. Core inflation includes more volatile energy and food prices. - Conventional Mortgage Rate FALLS to Upper 6's
Mortgage rates continue to be volatile. Rates fell to the lowest levels in about six months, only to rebound sharply to the 7% area, and have relaxed somewhat in recent weeks. This recent volatility is attributed to stock market and tariff news. Rates have been and will continue to be volatile with very high difficulty trying to time the market. VA/FHA rates are running about 1/2 point lower at 6.375%. Conforming rates are running about 1/4 point lower than the upper 6's jumbo rates (jumbo loan is > $1,209,750).

Tim Trainum Properties
Office: (571) 386-1075 Cell: (703) 568-6750 Email Me
- 43777 Central Station Drive
- Suite 390
- Ashburn, VA 20147
Office: (571) 386-1075 Cell: (703) 568-6750 Email Me

Privacy Policy / DMCA Notice / ADA Accessibility
This site is hosted, designed and copyright
© 1994 - 2026 by
Delta Media Group, Inc. -- Patent Pending --