Tim Trainum Properties
"Delivering a Preferred Experience in Real Estate!"
REALTOR®, VA License #0225235004

Key Local Market Info!
 RSS Feed
RSS Feed
- 2026 | 7 Posts
- 2025 | 12 Posts
- 2024 | 12 Posts
- 2023 | 12 Posts
- 2022 | 13 Posts
- 2021 | 13 Posts
- 2020 | 12 Posts
- 2019 | 15 Posts
- 2018 | 15 Posts
Subscribe and receive email notifications of new blog posts.
February
17
17
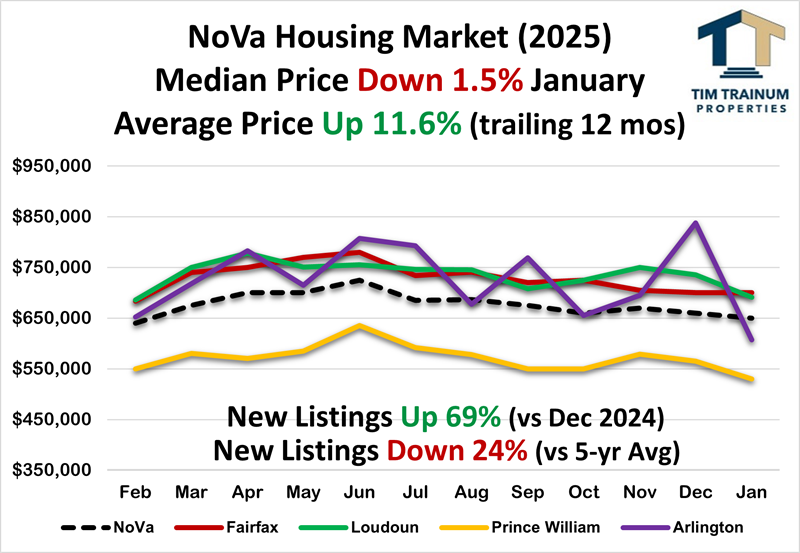
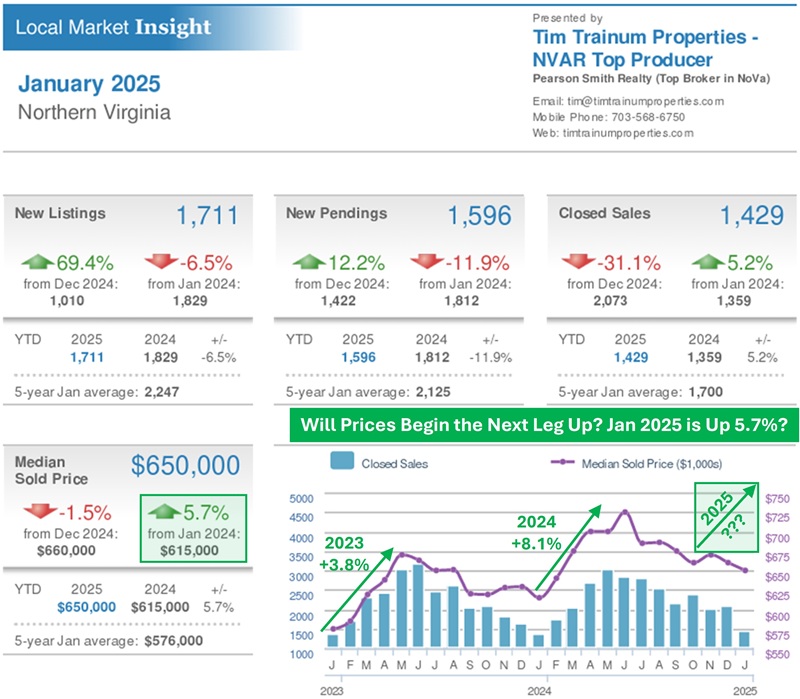
Northern Virginia Prices Begin 2025 Up 6%
January Highlights:
- MEDIAN PRICE BEGINS THE YEAR UP 6%
- Northern Virginia Prices UP 5.7% vs. Jan 2024
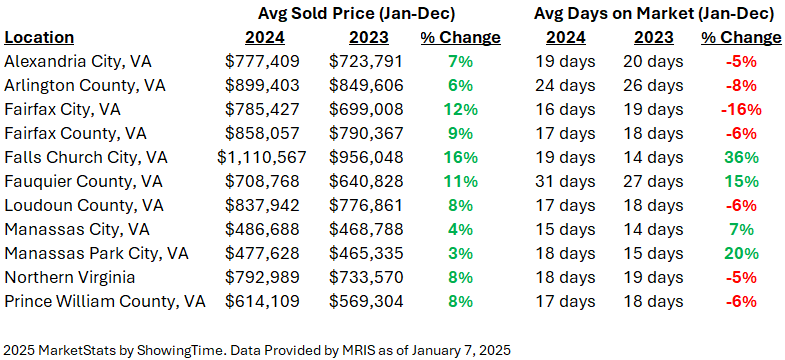
The median price of a Northern Virginia home increased 5.7% in January 2025 compared to January 2024. It typically takes a full Q1 to get a sense of how prices will trend for the year. For example, the average price is up 11.6% January to January. That 6 points spread between median and average will likely tighten toward the median price as each month's cumulative data is calculated. - Buyer Showings DOWN SOMEWHAT in 2025
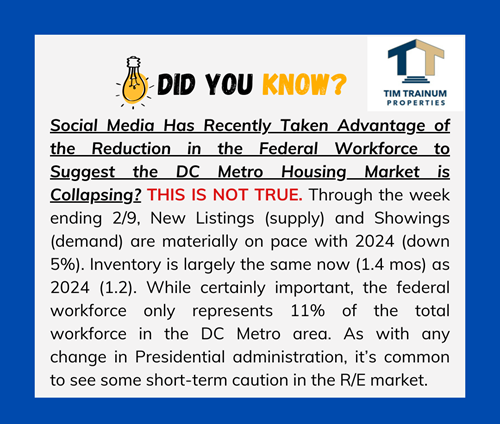
Overall, Buyer showings (demand) were down 7% in 2024 compared to 2023. While it's just January, this trend has continued somewhat in 2025. Depending on the week in 2025, showings have been equal to down 14% compared to 2024. - Listings UP 69% from December to January
This almost equaled the UP 70% in Jan 2024 and bettered the typical average UP 59% during the last 6 years. - January Listings DOWN 24% vs. 5-year Average
Seller listings stabilized in 2024 resisting the continued downtrend experienced in recent years. However, listings remain down significantly compared to long-term averages (-24%). With the 5-year average losing 2019 from the calculation, the negative number has improved about 10 points from last year's minus mid 30's. Northern Virginia homes sold in January (1,429) outpaced last year by 5.2% (1,359). - Rate Locked "Discretionary Sellers" STILL Staying in Place
In the wake of rising interest rates beginning in 2022, sellers largely "stayed in place" in 2023 and repeated the same in 2024, despite forecasts by economists that inventory would loosen up 15% in 2024. That didn't happen with just 27,623 New Listings in 2024 compared to 27,674 in 2023. New Listings in January were DOWN 4% compared to January 2024. The typical home seller is now 63 years old, a record high. This compares to age 54 in 2014 and age 45 in 2007. - Contract Ratio STEADY at 0.75 (shift toward buyers)
Listings Under Contract represent 43% of the total January listings compared to those available and Active for sale at 57% - largely the same as December. Contract ratios are at annual lows signaling a buyer-advantaged time of year but this will likely begin to change to seller-advantaged as we head into spring 2025.
- Persistent Low Inventory STEADY at 1.02 months
Inventory held relatively steady from 1.08 mos in December and is tracking similar to this time last year (1 mo in Jan 2024). - Buyers Continue Purchasing Strength in Jan 2025
Buyer contract prices averaged 99.0% of Seller Asking in January just like Jan 2024. The relatively lower Sold-to-List Price ratio speaks to buyer contingencies back in play as evidenced by contract cancellation rates being more than double now compared to typical spring behavior (now 12%). - Speed to Contract Continues Winter Slower Pace
Similar to last month, 43% of the 1,429 homes sold in January transacted in the fastest range (0 to 10 days) with 37% of sales exceeding 30+ days on market. Cash transactions represented 21% of the purchases in January.
- Fed Jan Meeting: RATE STEADY at 4.25%
The Fed met on January 29 with no rate cut. The futures market is presently showing a 96% chance of no rate cut at the next meeting scheduled on March 19. The Fed lowering rates has done materially nothing to influence mortgage rates which have increased 1 point since September. - Headline Inflation RISES to 3.0%, RISES 0.5% Dec to Jan
As reported last Wednesday, inflation increased from December 2.9% to January 3.0% year-to-year. This is the first move back into the 3's after seven months in the upper 2's. Inflation month-to-month also increased from 0.4 to 0.5%, a level not seen since March 2024. Some attribute the month-to-month change to companies increasing prices as usually done first of the year. "Core Inflation" remains in the 3's which includes more volatile energy and food prices. - Conventional Mortgage Rate FALLS into Upper 6's
Mortgage rates have relaxed somewhat back into the upper 6's. Since September, rates increased to near relative highs above 7% on economic news, despite 1 point of cuts by the Fed. Rates have been and will continue to be volatile with very high difficulty trying to time the market. Conforming and VA/FHA rates are running in the 6.25 to 6.50% range with jumbo loans in the 6.75% range (jumbo loan is > $1,209,750).

Tim Trainum Properties
Office: (571) 386-1075 Cell: (703) 568-6750 Email Me
- 43777 Central Station Drive
- Suite 390
- Ashburn, VA 20147
Office: (571) 386-1075 Cell: (703) 568-6750 Email Me

Privacy Policy / DMCA Notice / ADA Accessibility
This site is hosted, designed and copyright
© 1994 - 2026 by
Delta Media Group, Inc. -- Patent Pending --