Tim Trainum Properties
"Delivering a Preferred Experience in Real Estate!"
REALTOR®, VA License #0225235004

Key Local Market Info!
 RSS Feed
RSS Feed
- 2026 | 7 Posts
- 2025 | 12 Posts
- 2024 | 12 Posts
- 2023 | 12 Posts
- 2022 | 13 Posts
- 2021 | 13 Posts
- 2020 | 12 Posts
- 2019 | 15 Posts
- 2018 | 15 Posts
Subscribe and receive email notifications of new blog posts.
December
11
11
Northern Virginia Prices Firm in November; Setting Up a Spring Move Higher?
November Highlights:
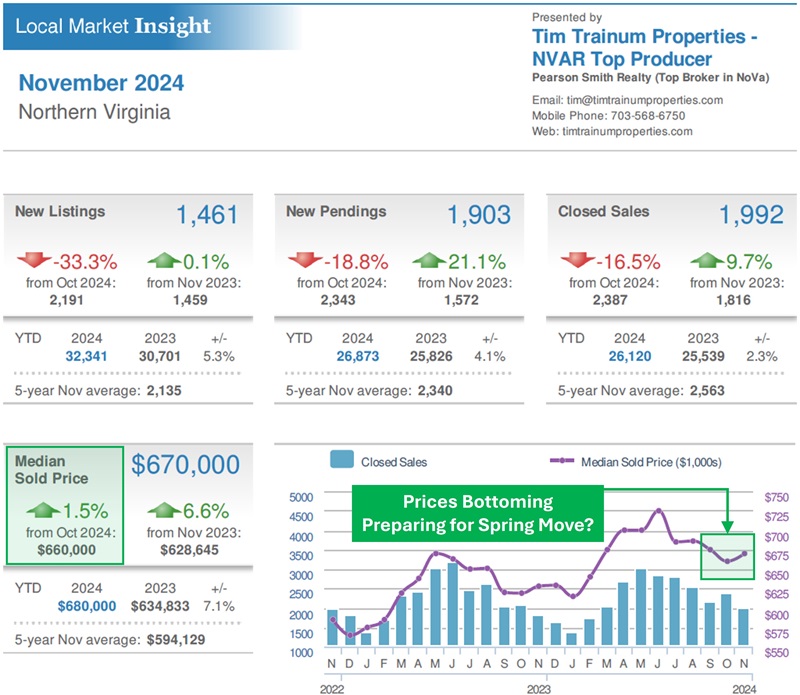
- PRICES BEGIN TO TIGHTEN FOR POSSIBLE SPRING MOVE?
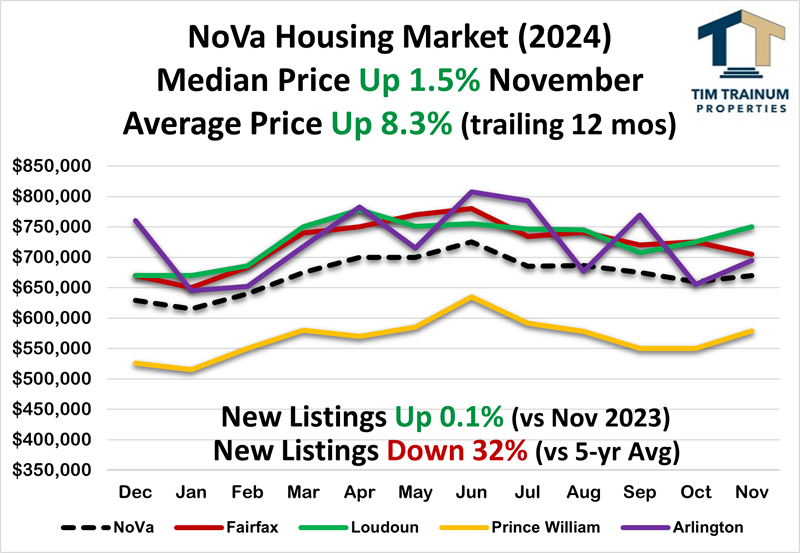
- Northern Virginia Prices UP 1.5%
Northern Virginia prices increased in November (contracts written in October). The Oct-Nov price move was consistent with the last 6 years averaging UP 1.3%. The YTD average price in Northern Virginia is UP 8.3% compared to the same period last year. During the seasonal decline in up markets, the market typically gives back 40 to 75% of the price gains experienced in the Jan through May/Jun peak. As shown in the graph below, the market has given back 50% of the 2024 gains. - Buyer Showings Dive to 2024 Lows
Buyer showings (demand) are diving to 2024 lows as the market enters the November-December holiday period. However, for the approximately 2,500 active listings in Northern Virginia, showings have been tracking 15% higher than last year since the Fed began reducing rates. - Listings DOWN 35% from October to November
This is on pace with the typical average DOWN 31% during the last 6 years. - November Listings DOWN 32% vs. 5-year Average
Seller listings have stabilized in 2024 and resisted the continued downtrend experienced in recent years. However, listings remain down significantly compared to long-term averages (-32%). Northern Virginia homes sold from Jan-Nov 2024 (26,120) are outpacing last year by 2.3% (25,539). - Rate Locked "Discretionary Sellers" STILL Staying in Place
These sellers largely "stayed in place" in 2023 and are doing the same in 2024, despite forecasts by economists. In late 2023, economists projected inventory would loosen up in 2024 rising 15% over 2023. That has not happened with just 26,613 New Listings in Jan-Nov 2024 compared to 26,597 last year. Instead of Listings (inventory) increasing 15% as forecast, they are unchanged YTD. The typical home seller is now 63 years old, a record high. This compares to age 54 in 2014 and age 45 in 2007. - Contract Ratio STEADY at 0.78 (shift toward buyers)
Listings Under Contract represent 44% of the total November listings compared to those available and Active for sale at 56%. Contract ratios are at annual lows signaling a buyer-advantaged time of year.
- Persistent Low Inventory FALLS to 1.01 months
Consistent with an increase in prices and the Sold-to-List Price Ratio, the inventory level fell from 1.41 mos in October and is tracking somewhat lower compared to this time last year (1.19 mos in Nov 2023). - Buyers Continue Purchasing Strength in Fall
Buyer contract prices averaged 99.0% of Seller Asking in November with buyer contingencies back in play as evidenced by contract cancellation rates being more than double where they were in the spring (now 14%). - Speed to Contract Slows in Fall
Similar to last year, 62% of homes YTD have sold in the fastest range (0 to 10 days). However, speed to contract has slowed from the 70% range experienced in the faster months as days on market typically grow in summer and fall months. For example, just 48% of the 1,992 homes sold in November transacted in the fastest range with 26% of sales exceeding 30+ days on market. Cash transactions represent 18% of the purchases, up 1 point from last year.

- Fed Nov Meeting: RATE CUT 0.25 to 4.50%
The Fed cut the fed funds rate 0.25 point as widely expected during the November 7 meeting. The Fed has now lowered the fed funds rate by 0.75% since September. The futures market is presently showing a 98% chance of an additional 0.25 point rate cut at the next meeting scheduled on December 18. - Headline Inflation RISES to 2.7%, RISES 0.3% Oct to Nov
As reported yesterday and in-line with expectations, inflation increased slightly from October 2.6% to November 2.7% year-to-year. This is the fifth consecutive month in the 2's after being firmly stuck in the 3-range for 13 consecutive months. "Core Inflation" remains in the 3's which includes more volatile energy and food prices. - Conventional Mortgage Rate STEADY in Low/Mid 6's
Mortgage rates reached a relative low in mid-September trading in the 5's which had not been seen since January 2023. Since September, rates increased 1% on economic news, despite a falling fed funds rate. Rates have been and will continue to be volatile with very high difficulty trying to time the market. Conforming and VA/FHA rates are running in the 6 to 6.5% range with jumbo loans in the high 6's (jumbo loan is > $1,149,825).

Tim Trainum Properties
Office: (571) 386-1075 Cell: (703) 568-6750 Email Me
- 43777 Central Station Drive
- Suite 390
- Ashburn, VA 20147
Office: (571) 386-1075 Cell: (703) 568-6750 Email Me

Privacy Policy / DMCA Notice / ADA Accessibility
This site is hosted, designed and copyright
© 1994 - 2026 by
Delta Media Group, Inc. -- Patent Pending --