Tim Trainum Properties
"Delivering a Preferred Experience in Real Estate!"
REALTOR®, VA License #0225235004

Key Local Market Info!
 RSS Feed
RSS Feed
- 2026 | 7 Posts
- 2025 | 12 Posts
- 2024 | 12 Posts
- 2023 | 12 Posts
- 2022 | 13 Posts
- 2021 | 13 Posts
- 2020 | 12 Posts
- 2019 | 15 Posts
- 2018 | 15 Posts
Subscribe and receive email notifications of new blog posts.
August
12
12
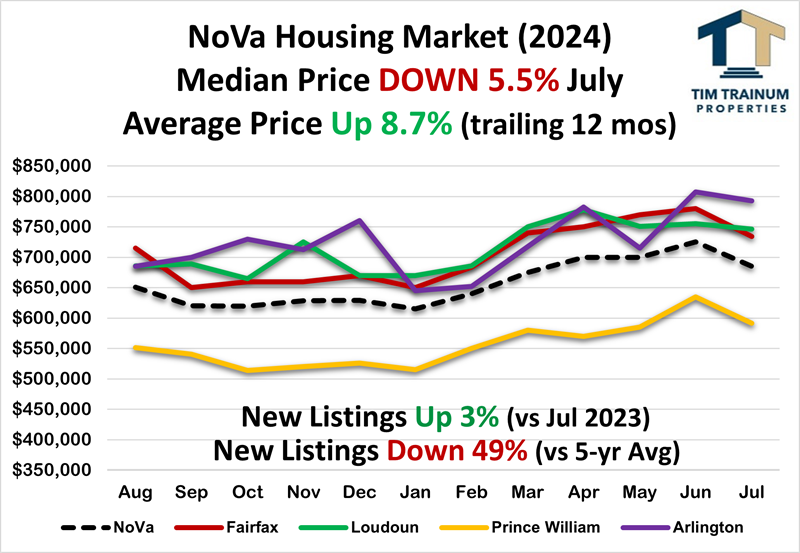
Northern Virginia Prices Fall; Starting the Seasonal Decline
July Highlights:
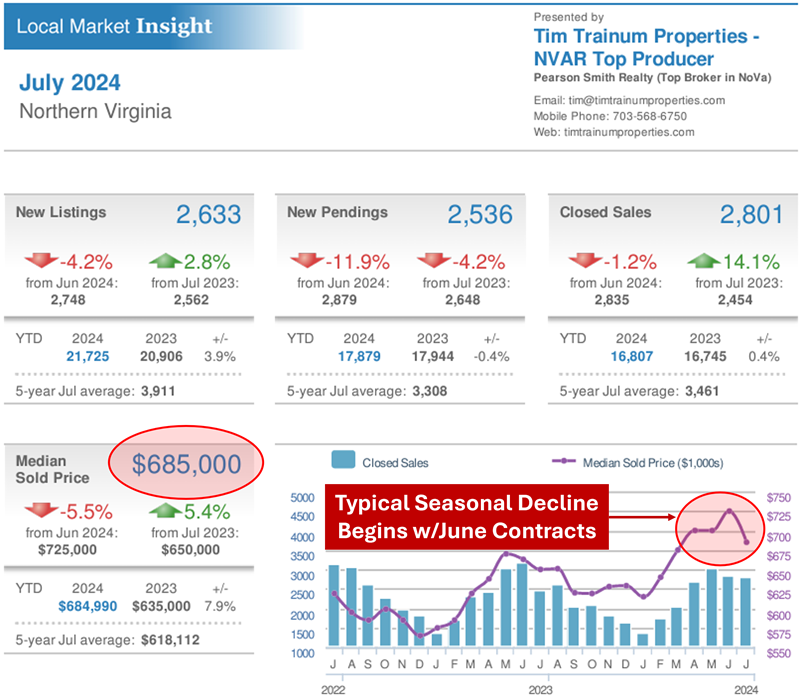
- SEASONAL PRICE DECLINE IS UNDERWAY
- Northern Virginia Prices DOWN 5.5%
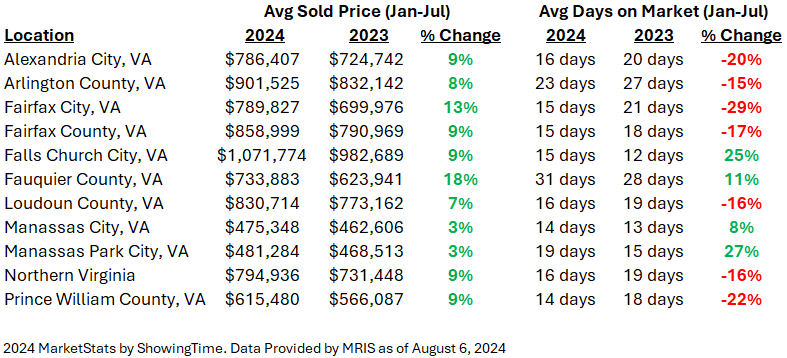
Northern Virginia prices fall in July (contracts written in June). All major sub-markets participated in the decline with Prince William (-6.8%) and Fairfax (-5.9%) leading. The monthly decline pushed the average price YTD down 50bp in Northern Virginia from 9.2 to 8.7%. - Buyers are Operating with More Conviction in 2024
Currently in August, buyer showings (demand) have seasonally fallen to near January lows. Overall, buyer showings in 2024 have tracked about 15 to 20% less than 2023. Despite fewer showings, home units sold are nearly the same as 2023 while prices are up 9% YTD compared to just 1% this time last year. Essentially, this means the market is doing more (prices up) with relatively fewer showings (demand). This indicates buyers are purchasing with more conviction this year, despite the higher interest rate environment compared to 2023. - Listings DOWN 4% from June to July
This is notably better than the typical average DOWN 15% during the last 6 years. - July Listings DOWN 49% vs. 5-year Average
Seller listings have stabilized in 2024 and resisted the continued downtrend experienced in recent years. However, listings remain down significantly compared to long-term averages (-49%). The number of homes sold Jan-Jul (16,807) is about the same as last year (16,745). - Rate Locked "Discretionary Sellers" STILL Staying in Place
These sellers largely "stayed in place" in 2023 and appear to be doing the same in 2024, despite forecasts by economists. In late 2023, economists projected inventory would loosen up in 2024 rising 15% over 2023. So far, that has not happened with just 18,082 New Listings in Jan-Jul 2024 compared to 18,151 last year. Instead of Listings (inventory) increasing 15% as forecast, they are unchanged YTD. - Contract Ratio STEADY at 0.93 (shift toward buyers)
Listings Under Contract represent 48% of the listing pool compared to available and Active Listings at 52%.
- Persistent Low Inventory STEADY at 1.06 month
Inventory level compares to last year (0.79 mos in Jul 2023). - Buyers: The Summer Pivot is Underway
As of the week ending August 11, there is a 20 pts spread between Listings (supply) and Showings (demand) benefiting buyers. Seller listings are 22% below the 2024 highs seen in April, while buyer showings are down 42%. It's certainly still a seller's market, but buyers can now navigate with notably less competition than earlier in the year. Consistent with reduced demand, escalated contract prices are waning, home inspection and appraisal contingencies are returning as evidenced by contract cancellation rates being more than double where they were in the spring (now 15%). - Despite Lower Demand, Homes Still Selling Fast
Last year, 65% of homes sold in the fastest range (0 to 10 days). Homes are selling slightly faster this year with 67% traded in the fastest range. Cash transactions represent 17% of the purchases. - Fed July Meeting: RATES HELD at 5.25%
The Fed held rates unchanged at the July 31 meeting. Chairman Jerome Powell left the door open to a rate cut at the next meeting on September 18 noting "inflation has eased substantially the last year". Presently, the futures market is showing a 100% chance of a September rate cut. The market is nearly even on a 0.25% cut (55% chance) or 0.50% cut (45% chance). - Headline Inflation FALLS to 2.9%, RISES 0.2% Jun to Jul
As reported today, inflation fell slightly from June's 3.0% to 2.9% year-to-year finally breaking out of the 13 consecutive months stuck in the 3% range. However, month-to-month inflation rose to 0.2% reversing the promising negative 0.1% deflation from May to June. Overall, this is above the Fed's 2% target they said they wanted to see sustained for several months before reducing the Fed Funds rate. It doesn't appear the Fed will follow their guidance with an expected rate cut in September. - Conventional Mortgage Rate FALLS; Ranges in the Mid 6's
Mortgage rates advanced their decline in recent weeks for two reasons. In part, due to the strengthening Fed position about a September rate cut. But more so, due to a sharp decline in stock prices after the unemployment rate rose sparking the threat of a possible recession. Rates fell to levels not seen since April 2023 before settling in the mid-6's. Conforming and VA/FHA rates are running about 0.50% less in the low 6's.

Tim Trainum Properties
Office: (571) 386-1075 Cell: (703) 568-6750 Email Me
- 43777 Central Station Drive
- Suite 390
- Ashburn, VA 20147
Office: (571) 386-1075 Cell: (703) 568-6750 Email Me

Privacy Policy / DMCA Notice / ADA Accessibility
This site is hosted, designed and copyright
© 1994 - 2026 by
Delta Media Group, Inc. -- Patent Pending --