
 RSS Feed
- 2026 | 7 Posts
- 2025 | 12 Posts
- 2024 | 12 Posts
- 2023 | 12 Posts
- 2022 | 13 Posts
- 2021 | 13 Posts
- 2020 | 12 Posts
- 2019 | 15 Posts
- 2018 | 15 Posts
Subscribe and receive email notifications of new blog posts.
20
2021 is a Competitive Year for Real Estate in Northern Virginia
What is an Absorption Rate; How is it Related to Housing Inventory?
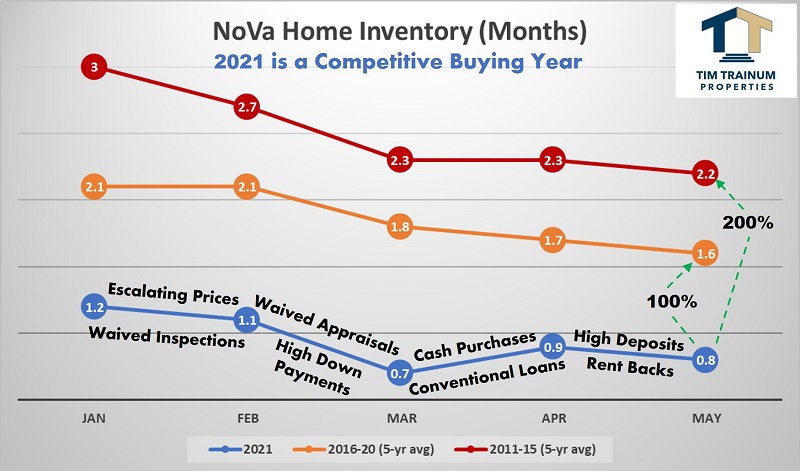
Absorption rate is a mathematical calculation used in various business applications. In real estate, absorption rate is a very important calculation to help understand the rate at which the market absorbs or eliminates housing inventory. Said another way, it measures how fast or slow homes are trading between buyers and sellers. Absorption rate is an important measurement I use when working with buyers and sellers. It helps my buyers understand market velocity and how that velocity is impacting home purchase terms. Likewise, the calculation is one of the factors used with my sellers to position and price a home for sale. Absorption rate is calculated by taking the number of homes available for sale in a given market, divided by the number sold in a given period of time. The product can be expressed as a percentage, or more commonly as the number of months inventory like in the graph above.
How Much Housing Inventory is Considered a Balanced Market?
Many people inside and outside of real estate refer to 5 to 6 months inventory as a balanced market. Generally, anything below that level is a seller's market and above is a buyer's market. However, real estate is local. The experience in one market is not the same as another market. Inventory can even vary between product types (e.g. detached, townhomes and condos). Each geographic area of the country has its own buying and selling texture and this includes the Northern Virginia region. To illustrate this point, consider the height of the housing collapse during 2007-09. In a thirty months period when the market was at its worse, there were only six instances when inventory in our region exceeded 6 months. Using the 5 to 6 months definition one would think we were operating in a balanced market, but we were not. Our market was saturated with inventory, including an elevated number of distressed homes in foreclosure. We were clearly operating in a highly advantaged buyer market. A balanced market in the Northern Virginia region is not 5 to 6 months like many other regions. Just 2 to 3 months inventory is considered balanced in Northern Virginia.
What is the 2021 Experience?
In 2021, Northern Virginia is operating below 1 month inventory. The line graph above shows the Jan to May 2021 inventory (blue line) compared to the 5-year average from 2016-20 (orange line) and 2011-15 (red line). There are astonishing differences between 2021 compared to previous years. Inventory levels in 2021 are running at ONE-HALF the 2015-20 period, which was considered a low inventory environment. Present inventory is ONE-THIRD of what was experienced in 2011-15. Viewed another way, it would take a 100% improvement in 2021 inventory to equal 2015-20 and a 200% improvement to equal 2011-15. This dramatic change in inventory and the high velocity at which homes are selling is why home buying has become much more competitive in 2021.
Present inventory levels (or the velocity at which homes are selling) is a buyer driven event for sure. "Low inventory" can be a bit misleading. A common misconception in the present market is a lack of listings have caused low inventory (sellers offering fewer homes for sale). Many are surprised to learn there have been 37% more homes sold through May 2021 compared to the same period last year - and 21% more homes sold than 2019 (pre-pandemic). The key difference is the excess number of buyers who have entered the market. An oversupply of buyers have pushed inventory levels to all-time lows, and likewise, produced the very competitive home purchasing terms experienced so far in 2021.

- 43777 Central Station Drive
- Suite 390
- Ashburn, VA 20147
Office: (571) 386-1075 Cell: (703) 568-6750 Email Me

Privacy Policy / DMCA Notice / ADA Accessibility