
 RSS Feed
- 2026 | 7 Posts
- 2025 | 12 Posts
- 2024 | 12 Posts
- 2023 | 12 Posts
- 2022 | 13 Posts
- 2021 | 13 Posts
- 2020 | 12 Posts
- 2019 | 15 Posts
- 2018 | 15 Posts
Subscribe and receive email notifications of new blog posts.
20
Is the Northern Virginia Housing Market Signaling a Bubble in 2021?

Housing Bubble Concerns Rise Among Some Consumers
Some home sellers and buyers alike have become concerned about home prices. It's an asset class they either own or consider buying. This concern has grown significantly for some in 2021 given the strong price moves and national attention the housing market has received in the media. What's more, the impacts of the Great Recession and 2008 housing collapse are still visible in the rearview mirror for so many people. Are we in a housing bubble, again? I've prepared a few graphs containing some important statistical data to help put context around the possible answer to this question.
Historical Prices Reveal Compelling Context
Fairfax County is one of the most accurate housing barometers in our region. It is the largest statistical area within the Washington, DC metropolitan region and represents approximately 20% of the metro area's population. Fairfax County is also the largest housing sub-market in our region accounting for $11 billion of the total $25 billion Northern Virginia home sales in 2020. The line graph below shows the House Price Index tracked by the St. Louis Federal Reserve Bank.
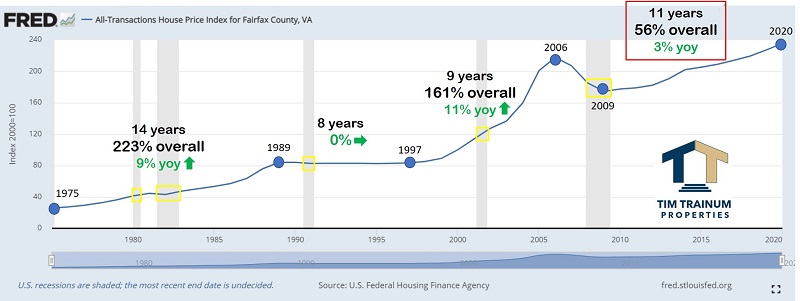
I've listed below what I believe to be the most important pieces of information that can be pulled from the graph when considering warnings by others of an approaching housing bubble and price collapse.
- During the last 45 years (from 1975 to 2020), home prices have increased by 5.1% year-over-year (yoy). The current period's appreciation of just 3% yoy (2009-20) lags the overall average, and measurably lags the 11% yoy experienced during the 1997 to 2006 run-up.
- There have been just two definable housing market collapses since data collection began in 1900. The Great Depression in the 1930's and the Great Recession in 2008-10. Generally speaking, when considering average hold periods, real estate owners have experienced appreciable gains in asset class prices during almost every time period throughout history, except for the very specific time frames of the Great Depression and Great Recession. Both of which account for just 5% of the 120-year time frame.
- The vertical grey areas in the graph show the last five recessions on record since 1975. The yellow boxes capture the slope of the lines to illustrate how home prices have generally appreciated through previous recessions. The exception was the 2008 housing collapse which was the root cause of the Great Recession. Many consumers are surprised to learn home prices are often resilient in times of recession.
- Home prices broke-out to all-time highs in 2018. This occurred after a 12-year recovery and from a constructive price base. From purely a technical perspective, it could be argued housing prices are just beginning the next bull run with anticipated years of appreciation to come like previous historical moves.
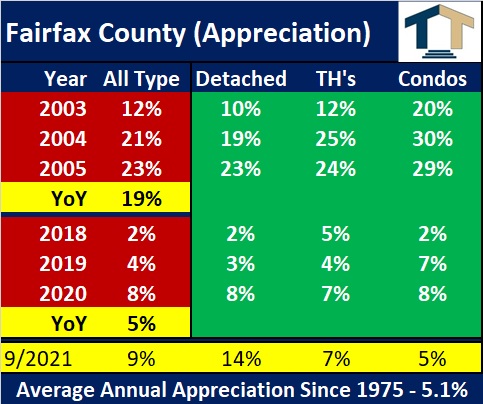
Comparing the Most Important Time Frames
Here's a look at the three-year periods of 2003-05 and 2018-20 in the chart below. The 2003-05 period represents the last three years prior to the collapse in home prices. During 2003-05, home prices appreciated a staggering 12%, 21% and 23% during the final years of the run-up. This was a 19% yoy move, almost 400% more than the historical average of 5%. What has occurred in the last three years from 2018-20? While appreciation levels have accelerated from 2% to 4% to 8% the last three years, the yoy move simply equals the historical average of 5%. So far in 2021, we've seen prices escalate 9%. If 2021 finishes at a 9% pace, it will increase the last 3 years yoy (2019-21) to 7%, still well below the 19% experienced in 2005. One statistic of note - our local market has seen the detached home product segment appreciate 14% in 2021. While this is a number worth noting, it is related to an almost immediate change in consumer sentiment concerning the pandemic with buyers showing a clear preference for detached homes. This is not anticipated to become a permanent change as we exit the pandemic and return to normal behavior.

- 43777 Central Station Drive
- Suite 390
- Ashburn, VA 20147
Office: (571) 386-1075 Cell: (703) 568-6750 Email Me

Privacy Policy / DMCA Notice / ADA Accessibility